City Digital Twin AR Zoom Lens - Research Document
Fontys Lectorate High Tech Embedded Systems Eindhoven
Eindhoven
| Date | 31-03-2023 |
|---|---|
| Version | 2.1.0 |
| Status | Second Draft |
| Author | Skyler Vermeer |
| Version | Date | Author | Amendments | Status |
|---|---|---|---|---|
| 0.1.0 | 8-2-2023 | Skyler Vermeer | Layout | Layout Draft |
| 1.0.0 | 10-2-2023 | Skyler Vermeer | Added Research Question 1 | Draft |
| 1.1.0 | 13-2-2023 | Skyler Vermeer | Added Research Question 2 | Draft |
| 1.2.0 | 16-2-2023 | Skyler Vermeer | Add introductions sections, Spelling + Grammar Check + Chosen domain (conclusion) | Draft |
| 1.2.1 | 3-3-2023 | Skyler Vermeer | Process feedback Simona (1.2 structure + change sources to references + added layout for new questions) | Draft |
| 2.0.0 | 6-3-2023 | Skyler Vermeer | AR techniques research | Second Draft |
| 2.0.1 | 7-3-2023 | Skyler Vermeer | AR frameworks research | Second Draft |
| 2.1.0 | 16-3-2023 | Skyler Vermeer | Incorporate Expert Interview + adding more structure with headings and such | Second Draft |
| 2.2.0 | 31-3-2023 | Skyler Vermeer | Incorporate designs | Second Draft |
| 3.0.0 | 20-04-2023 | Skyler Vermeer | Incorporate POC’s in AR research | Third Draft |
Communication
| Version | Date | To |
|---|---|---|
| 1.2.0 | 17-2-2023 | Simona Orzan |
| 1.2.1 | 3-3-2023 | Frank Schürgers |
| 2.1.0 | 5-4-2023 | Simona Orzan |
Abstract
In this document, we will answer the question “How can the severity of city problems in Eindhoven be visualized using Augmented Reality?”.
The goal of this document is to create an overview of the research done, with sources, summaries and conclusions. In case more detailed answers are in another document, the relevant documents will be referenced.
To do this, we will use the research questions as defined in the project plan and answer them using the documents that our research consisted of.
Table of Contents
1. City problems
The first aspect we need to research is city problems. This is to make sure we pick a problem that is still a problem, fits with our requirements of Augmented Reality, Location Based Data and Artificial Intelligence, and needs to be made more tangible.
1.1 Which city problems are being monitored in Eindhoven?
The city of Eindhoven is monitoring several problems so they can see the progression and create and evaluate policies based on it. They also share the data from their sensors publically. This research will focus on the nature and climate-based problems that can be influenced by humans.
These topics were found on the data portal of Eindhoven, under the topic ‘Nature and Environment’ (Explore — Eindhoven Open Data, n.d.)1 Based on this list, the following is an analysis of the causes related to the data that is being monitored.
Population Growth
One of the problems that are being monitored is the effects of population growth. The growing urban population is causing an increase in air temperature, CO2 and other air pollutant emissions. This has led to a decrease in stored carbon and is threatening ecosystems and mankind. Because of the higher temperatures, there is an increase in air pollution due to an increase in ozone formation and as energy demands for cooling increase. (Impacts of Nature-Based Solutions on the Urban Atmospheric Environment, n.d.)2
Urban Growth
Another one of the problems that are being monitored is the effects of urban growth. Due to urban areas expanding, natural habitat is converted into cities. This leads to a big loss of biodiversity as the number of species is globally on average 50% lower at urban sites than in intact natural habitats. However, the indirect effect has an even larger impact. This is due to the increased resources consumed within the city, and the increased pollution released from cities. It is estimated that the area required to feed the world’s cities is 36 times greater than the urban area of cities (McDonald et al., 2020)3
Due to the urban growth, there is also more road traffic and construction areas, which are the main sources of particle matter in metropolitan areas. (Pope et al., 2009) 4
1.2 What impact do these city problems make?
Population growth and urban growth each have different consequences, as mentioned in the previous question. This question aims to explore these consequences and discover which impacts they each make.
Increasing Air Temperature
One of the consequences of population growth is that the air temperature is increasing. This is because, with the increasing population, the demand for resources is also increasing. This leads to higher emissions of greenhouse gasses, which in return leads to a higher concentration of CO2 in the air. CO2 traps heat in the atmosphere, leading to a heightened air temperature. Though a heightened CO2 does improve the functions of some processes in plants, the benefit we gain from this is limited as once the temperature rises too much the heightened CO2 can no longer compensate for the diminishing effects caused by temperature-sensitive processes. Wang et al 5 found that after an increase of 2 oC the heightened CO2 no longer compensated for the heightened temperature. This was based on the temperature in 2018, and the temperatures are estimated to rise between 0.1 oC and 0.3 oC each decade, and the rate is increasing (Chapter 1 — Global Warming of 1.5 oC, n.d.) 6
Due to these temperatures rising, the glaciers and ice sheets are melting. The water that comes free from this as well as the thermal expansion of seawater as it warms is causing the water levels to rise. The global mean sea level has risen approximately 3.6mm per year from 2006 to 2015. This is an increase from the 1.4mm that was the average of most of the 20th century. (Climate Change, n.d.) 7
Increasing Air Pollutant Emissions
Another thing that is increasing in the air, is air pollutant emissions. This is a consequence of both population growth and urban growth. They are especially noticeable in the increased value of O3 and NO2. Urban NO2 daily patterns are noticeably influenced by traffic, with peaks in the morning and late afternoon and a decrease in concentrations during the weekend. In the winter heating processes are used a lot more often, which can explain the heightened concentrations even in places that are not or are less influenced by the traffic.
NO2 is a precursor to O3, which is why there is a negative correlation between O3 and NO2. The increase in solar radiation throughout the day in combination with the presence of other precursors promotes ozone formation and concentrations increase. During the night, the increase in NO2 leads to O 3 consumption. This is why hotter months have higher O3 concentrations due to the longer and higher intensity solar radiation. During the weekend, the average O3 concentrations are higher than during weekdays due to the lower nitric oxide levels and VOC emissions in the morning, which build up through photochemical reactions. ( Impacts of Nature-Based Solutions on the Urban Atmospheric Environment, n.d.) 2
Loss of Biodiversity
One of the other consequences of urban growth is the loss of biodiversity. As a result, the way ecosystems function is affected in several aspects. It reduces the efficiency by which ecological communities capture biologically essential resources. These resources are nutrients, water, light and prey. It also reduces the efficiency with which biomass is produced, as they are dependent on the production of these biologically essential resources. Due to the decrease in plant litter diversity, the decomposition and recycling of biologically essential nutrients after organisms die are also affected.
This loss of biodiversity is creating an impact on the stability of ecosystem functions. Different life forms have different responses or competitive interactions to environmental fluctuations. This can lead to asynchrony which means the ecosystem becomes unbalanced. Additionally, the number of species needed to sustain a single ecological process is lower than the number of species needed to sustain multiple processes simultaneously. So even if we were to stabilize a single process, ecosystems are multifunctional and need more biodiversity to maintain that.
Hooper et al 8 revealed that the impacts of species loss on primary productivity are of comparable magnitude to the impacts of other global change stressors. If we try to increase or at least maintain the current biodiversity, this would have a positive impact to combat the negative effects of both population growth and urban growth. Diversity increases the yield of commercial crops, the production of fodder and greater stability of fisheries yields. In diverse plant communities, plant pathogens are less prevalent. It also increases aboveground carbon storage as biomass production is enhanced. Nutrient mineralization and soil organic matter also increase with plant richness (Cardinale et al., 2012) 9
Increase in Fine Dust Particles
A third consequence of urban growth is an increase in fine dust. Fine dust is a mixture of particles < 10 µm (0.01mm) of which they are often categorized into the subgroups PM10, PM2.5 and PM1. They are from various sources such as combustion processes which also produce gaseous substances in addition to particulate matter which combined with agricultural ammonia emissions contribute to secondary fine dust formation.
The main sources of fine dust formation can be categorized into metropolitan, airport and agricultural. Fine dust particles come from a variety of sources, natural sources such as sea salt, but also unnatural ones such as wear and tear and combustion. The natural sources aren’t necessarily a problem, we need them as they block parts of the sun and they reflect the light (Otjes & Close, 2023) 10. There are also varying sizes of fine dust particles, of which PM1 is the most dangerous, excluding Ultra Fine Particles (UFP) which are so small that measuring them is quite expensive (J.P. Close, personal communication, March 7, 2023).
Fine dust is harmful to the health of people. This is because its chemical and physical properties produce oxidative stress on mitochondria, DNA and proteins. It can also cause systemic inflammatory reactions. It has been connected with cardiovascular disease and some cancers (Ritz et al.,2019) 11. This effect is exacerbated when someone smokes, as this gives an immense amount of fine dust particles direct access to the airways. Not all types of fine dust particles are particularly harmful, for example, sea salt is not as harmful as combustion fine dust particles. The human body does have some defences to prevent fine dust from entering, but PM1 is so small that it goes through the external defences of the human body and does not (easily) dissolve in liquid. Moustache hairs block PM2.5 and PM10, but PM1 still goes through. The same goes for UFP, which can pass through the gaps between the molecules of which the human body consists. An example of the effects of this would be when a person is pregnant and the fine dust particles impact the development of the brain of the baby, causing disorders such as ADHD and Dyslexia.
The behaviour of fine dust is dependent on the weather. This is also what makes it so hard to predict, as it is hard to predict how the weather will have affected the concentration of fine dust particles between now and the moment and location that is being predicted. Fine dust particles are particularly affected by the wind. It descends and if the wind is blowing, it disperses and moves with the wind to a different location. This is both a good and a bad thing, as it means that wind can both remove fine dust particles from our area, as well as bring them to us, which is what happens when there is a lot of traffic in the morning and the wind blows the particles over the entire city. However, no wind is even worse, as this means that the particles stay in the air, collecting together until there is a thick layer, often at breathing level. UFP is an exception in the behaviour of fine dust particles when encountering wind, as they are not affected by it. Another impactful weather event is inversion. When cold and warm air is pressed together, because of inversion, the fine dust particles are also pressed together, which often happens at breathing level, making it easier to breathe in higher concentrations of fine dust. However, precipitation, on the other hand, has a positive impact. The particles attach themselves to the raindrops and snowflakes and land on the ground where they are less likely to enter our airways. The environmental temperature also has an effect, as fine dust particles have a different shape in the summer than they have in the winter, as the temperature is a catalyst for chemical reactions with air pollutants such as ozone which changes the shape and properties of the particle. (J.P. Close, personal communication, March 7, 2023)
Conclusion - Which city problem will we be focussing on?
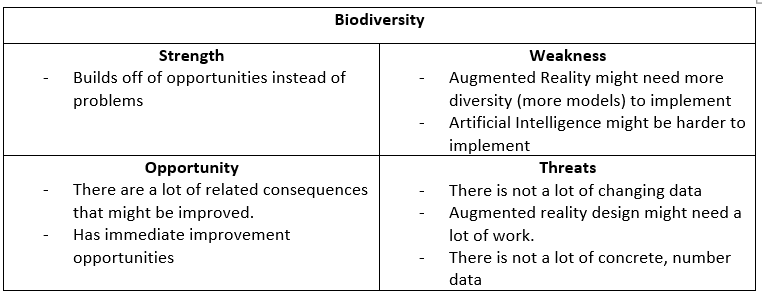
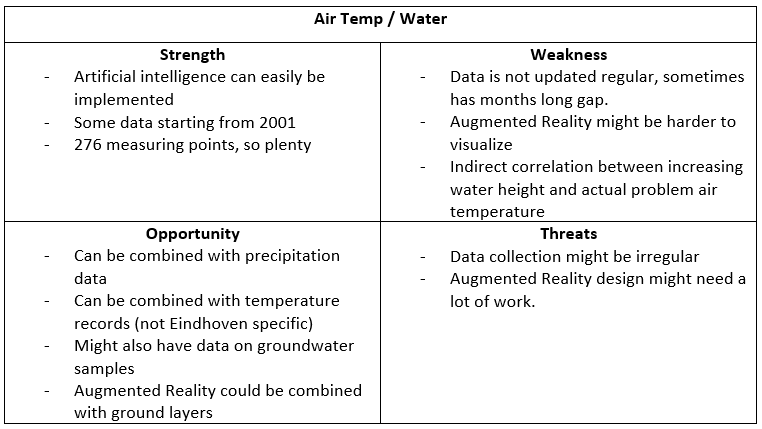
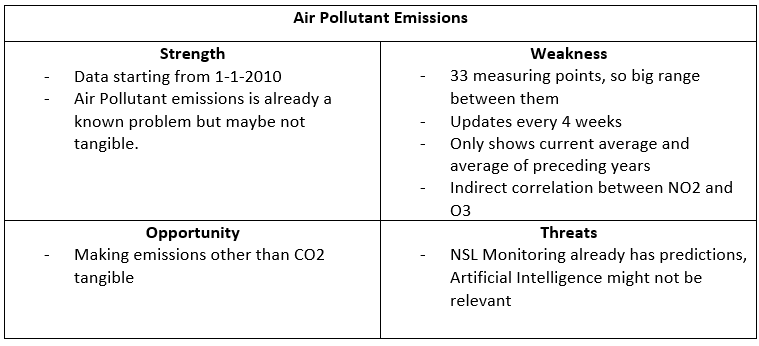
Based on this research and the available data I made a SWOT analysis for each domain to choose from. 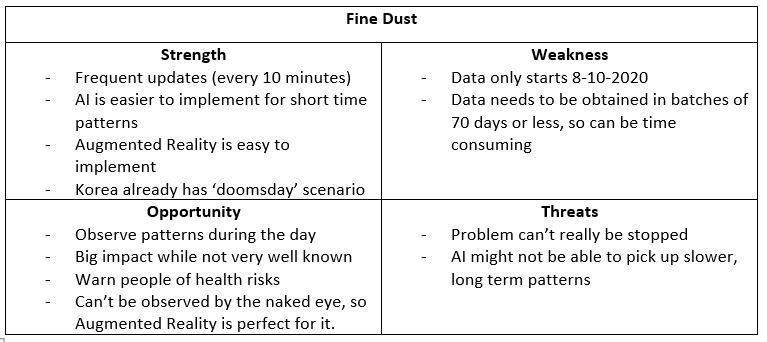
Though Simona had done her own research into what was possible, she agreed with picking Fine Dust as this was the one with the most potential for success and would incorporate AR and AI the best.
The second choice was Biodiversity, using a model to predict which plants would be at a certain location based on temperature, wind, precipitation etc. However, this would mean a lot of AR models of plants, and seeing as there wasn’t a concrete dataset yet that we had found that we could use we decided that we better go for fine dust as we could expand to air pollutant emissions at a later date based on the basic zoom lens application that would be created for fine dust.
Air pollutant emissions didn’t give enough room for prediction as the data was essentially yearly. Air temperature and water had too much unreliable data and didn’t show the problem direct enough.
With fine dust, we can make time-based models, but also models that use wind, temperature and humidity and similar features so people can adjust these values themselves and create their own environment or ‘future’ scenario.
2. Visualization
As per the requirement of the City Digital Twin project, we need to incorporate Augmented Reality into the project. Through this, we can make data more comprehensible for regular people in the city of Eindhoven and can display things that are normally not visible such as Fine dust particles.
Augmented Reality is defined as a real-time direct or indirect view of a physical real-world environment that has been enhanced/augmented by adding virtual computer-generated information to it.
Augmented Reality brings virtual information to the user’s immediate surroundings and any indirect view of the real-world environment. It enhances the user’s perception of and interaction with the real world. Instead of completely immersing the user in a synthetic world, AR technology augments the sense of reality by superimposing virtual objects and cues upon the real world in real-time. AR could potentially apply to all senses and can be used to augment or substitute the user’s missing senses by sensory substitution. AR applications can also remove real objects from the environment. This is usually called mediated or diminished reality. In this case, the object is covered with virtual information so the user has the impression that the object is not there (Carmigniani & Furht, 2011) 12.
2.1 How can this problem be visualized?
Concept Designs
To visualize this problem, based on the requests and feedback from the stakeholder and expert we started by creating sketches. 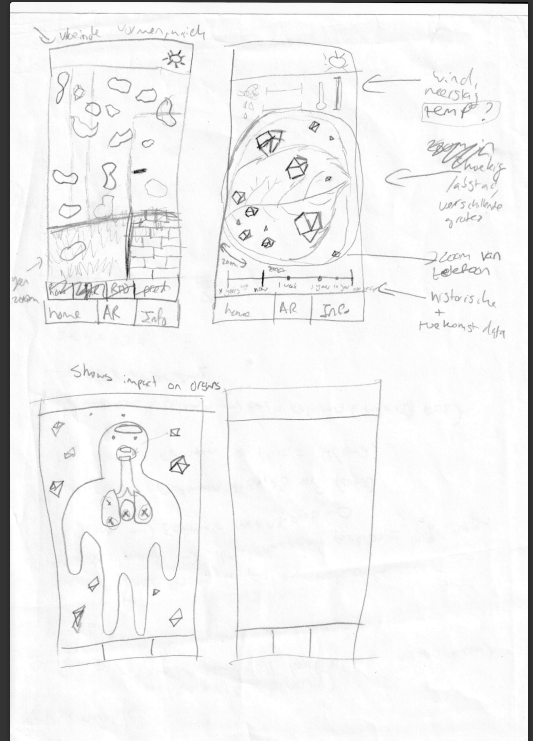
After creating these sketches, we talked them through with the stakeholder. She said that the zoom-in designs both look good, and the zoomed-in version looks the best. A good idea is to add a ‘confidence level’ to the designs to indicate how accurate the visualisation is. Based on this feedback, we adjusted the sketches into Figma clickable wireframes. 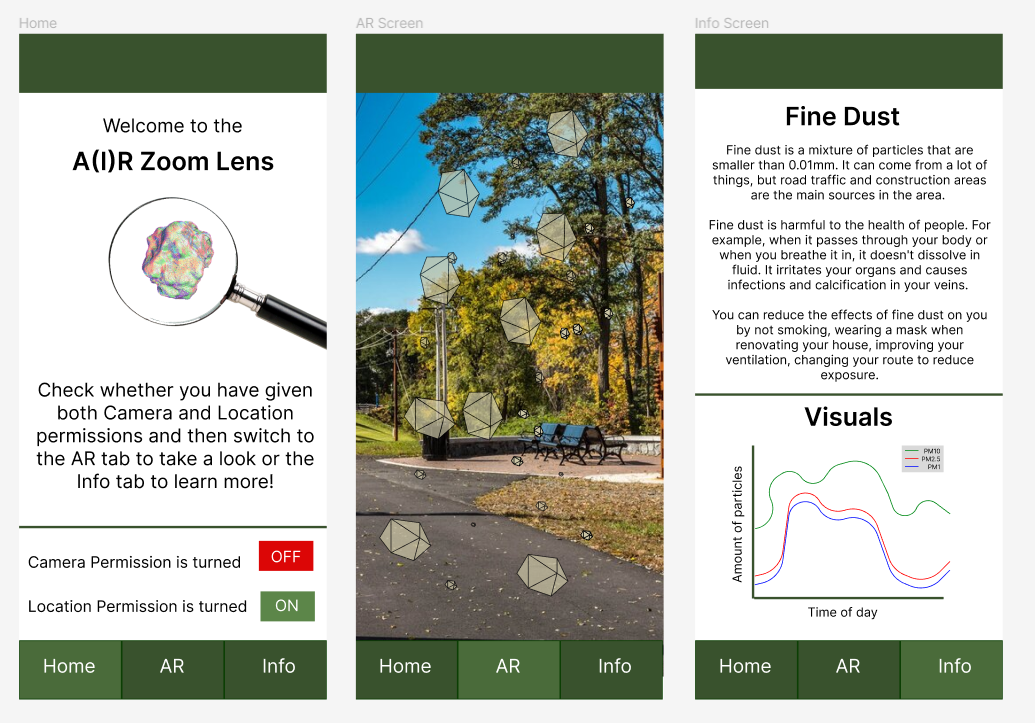
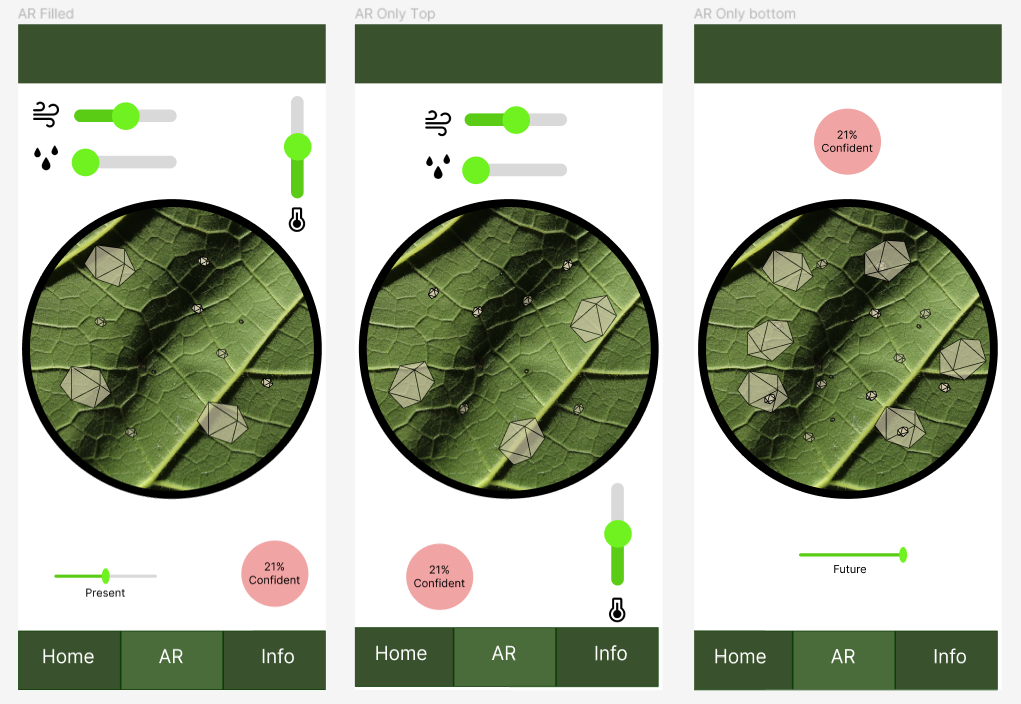
These were then shown to Media Semester 6 students and based on their feedback, as referenced in the Feedback Report the designs were adjusted again. Their main feedback was to make the text larger, add icons to labels, replace text with icons and add labels to existing icons. They also mentioned that the sliders should be moved to the bottom to make it more ergonomic. That is why in the updated designs the info screen has a scroll functionality to account for the bigger text. There is a combination of icons and images, with a settings screen to allow the user the autonomy to remove one or the other.
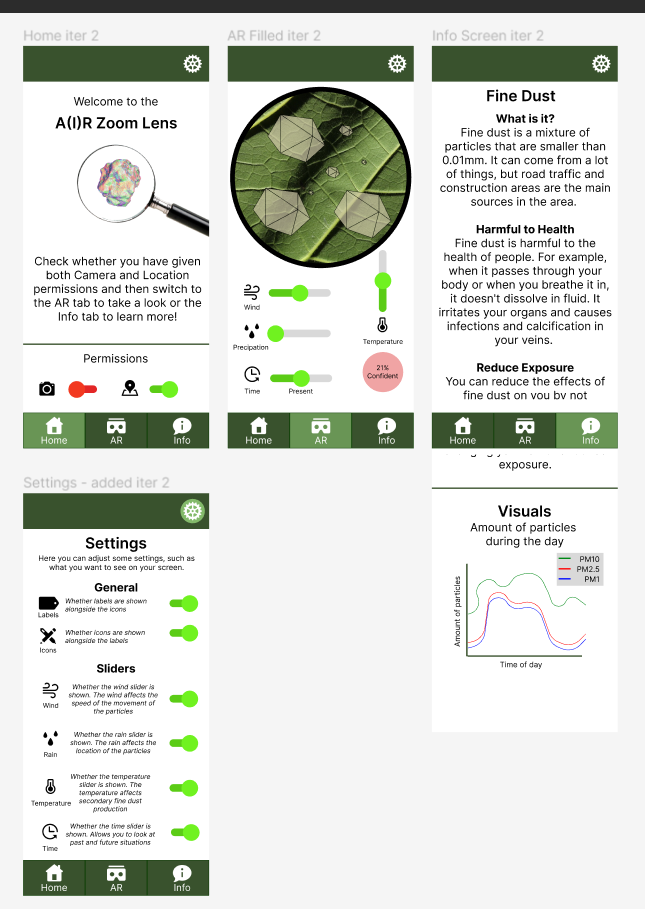
I checked these designs with my stakeholder, and they agreed that this was the design we were going to use.
2.2 - What is the best Augmented Reality technique for this application?
Types of Augmented Reality
These types are based on the research of Aytaç Sarkmaz (Frontend, n.d.) 13, to have a limited pool on what to focus on. There are two categories of AR, marker-based AR and markerless AR. The difference lies in the information source for the position of the digital content within the user’s view.
Marker-based
Marker-based is based on the principle that the system needs to know where the user is and the position that the user wants to focus. This could be done by adding a predefined marker in the environment, which can be in the form of a 2D picture, QR code, or 3D object. Using this marker, computer vision techniques can be used to detect it, a process called ‘tracking’. This marker makes it easier to identify the position of the virtual objects to be displayed ( Boonbrahm et al., 2020) 14.
Face-AR
In the case of Face-AR, your face is the marker. Using face detection, a mask-like image is placed over your face, altering your facial features in a realistic or unrealistic way. Face detection uses local features such as your eyes and nose to identify the dimensions on your face and adjust the overlay accordingly as well as track your face when it is moving (Ahmed, M. N., 2016) 15.
Markerless AR
With markerless AR, a combination fo GPS and the compass sensor on the smartphone is used to place the virtual object at any position within the range of the camera view. An example of this is Pokémon Go. There are also platforms that use data from a device’s motion sensor and camera to identify spatial movement across six axes. This makes it so virtual objects remain accurately positioned in the real world. It also adds a plane detection function, so the virtual items can be placed onto surfaces in a realistic way (Boonbrahm et al., 2020) 14.
Location-based
Location-based Augmented Reality revolves around localizing the user and placing a 3D object somewhere relative to the user’s location. The localization can be done through various methods based on the requirements.
Localization systems are constantly evolving. Early versions used radio signals and a remote server to determine the user’s location. Radio Frequencies (RF) tend to be able to reach where regular GPS fails, such as indoors and in urban environments due to their higher power levels, wider coverage and their ability to penetrate buildings due to their lower frequencies. However, they usually do not carry timing, which is critical in range calculation and they are prone to degrading due to other signals. They were also not made for localization (Moghtadaiee et al.,2011) 16
Simultaneous Localization and Mapping (SLAM) approaches are mostly developed for robots, and use a variety of sensors to position a robot in an environment, using things such as sound, infrared and landmarks to map the environment in real time (Chong et al., 2015) 17
The 6 Degrees of Freedom (6DOF) pose estimation uses the 6 axes that a rigid body can move in a 3D space to estimate the position relative to for example images from a dataset.
However, the most widespread is standard GPS localization, combined with the positioning of the phone through its native sensors and surface detection (Paucher & Turk, 2010) 18
Projection Based / Spatial AR
Spatial AR uses projections to augment the physical environment of the user regardless of their field of view. There are several versions of this, such as with and without head tracking. Without head tracking, the images do not constantly change while the user moves. With head tracking, the images are updated dynamically (Behringer et al.,1999) 19
Frameworks / Platforms
There are a variety of frameworks and platforms to develop AR with. That is why we narrowed it down to the frameworks researched by Aytaç Sarkmaz (Frontend, n.d.) 13. The information was verified in the documentation and adjusted as some of it was outdated.
8th Wall
8th Wall is a complete AR solution. It has a variety of advanced features including SLAM, 6-DoF and responsive scaling. You can also enable occlusion and physics so you can add interaction between your virtual environment and the physical world. It is compatible with a large number of 3D frameworks and browsers and is made to integrate with computer vision technologies like machine learning models and external libraries such as location services. However, it is quite expensive at $9 - $3000 / month.
ARCore
ARCore is Google’s AR platform. However, it only works on Android and iOS. It has an understanding of its environment such as the size location and debt and allows for motion tracking and anchors. It is free to use.
AR.js
AR.js is a lightweight library for AR on the web. It will run on any phone with WebGL and WebRTC. Something good to know is that Firefox does not give accurate device orientation so location-based AR will not work correctly. Chrome might open the wrong camera when there are multiple camera’s on a phone. It also always has to be deployed under HTTPS. It is free, however, the support is paid. It supports Image-Based, Marker-based and Location-based AR.
Banuba
Banuba specializes in Face AR. It has a variety of features related to the face such as tracking, audio, masking, face morphing and many more. It is supported on multiple platforms, such as Android, iOS, Web, Windows, MacOS and Unity. It has a free trial but after that it is paid and the final cost is unclear as you only pay for the features you need.
Unity
Unity supports combining ARCore, ARkit, and WebAR. You can develop an application for multiple platforms simultaneously. It supports the key features from multiple platforms, as well as the unity features such as photorealistic rendering, physics and device optimizations. You can also use Unity as a library to embed it in your existing mobile app. The pricing ranges from free for individual use to just under 3000 a year per seat for enterprises.
WebXR
WebXR is a group of standards which are used together to support VR and AR. However, it is not yet implemented in a lot of browsers so users would need to download things or edit settings to be able to run it. It is however compatible with a lot of things such as immersive headsets and AR-Core compatible devices. It also has multiple aspects to make the XR experience interactive. It appears to be free.
WebARkit
WebAR Kit wants to take the best from open-source WebAR and take it to the next level as the ARtoolkit project is dead and its successor is not web-friendly. However there doesn’t appear to be anything concrete yet, and the last update was April 7, 2021, so it seems that this project is not continuing and not useful yet.
Zapworks
Zapworks is a complete toolkit just like 8th Wall. However, it lacks some features but compensates in pricing. It has trouble anchoring due to not supporting world tracking on the web. It allows the creation of AR experiences without coding or with low code. It supports a variety of the above-mentioned features and has a 14-day free trial. After that, it is 58-435 euros per month, with custom pricing for enterprises. It is compatible with Safari and Chrome, and a large amount of 3D JS frameworks. It has image and face tracking.
2.2.1 Which Augmented Reality techniques can we work with?
Proof of Concepts
Based on our theoretical knowledge of the types of AR and the frameworks we would need to develop them, and our knowledge of the project, we can say that we will either have to use Location-based AR or have the phone as the marker and place things relative to the phone. This is because we are working off of coordinate data, but want the visualization to be somewhat relative to the user so it is immersive. This could be done by getting the location of the phone, referencing it to the data we want to visualize, and displaying the 3D models around the user.
If we want to use location-based, our options for development are 8th Wall or AR.js, and seeing as AR.js is free this is definitely an option. However, it is also known to not be extremely user-friendly when developing, so if that doesn’t work out, we can also work with Unity in a non-location-based application way. Unity implements ARCore and a variety of features and would also be free to develop with, along with a friendlier user interface.
However, before we can decide what we will be using, we need to make a few proof of concepts to see whether they will work. Something to note is that the development of these concepts happened mostly simultaneously, so some aspects do overlap.
Unity
To start experimenting with Unity, I followed a tutorial on Augmented Reality with Unity. The tutorial that was provided by Unity itself was throwing a lot of errors, so we decided to approach it differently and use a (Create an AR Game Using Unity’s AR Foundation, n.d.)20. We got the camera to work and have a model display at the location of the camera. However, initially, it was just stuck in the position where the camera pointed first.
There is an error in the tutorial, where it is missing some code. By using a Youtube tutorial, we were able to find the error area and alter the code. (Indra M, 2022)21 We also figured out that we were using the wrong ‘version’, as we needed one that used the Universal Render Pipeline so we had the ForwardRenderer Script. After recreating the project using the correct setup, we were able to correct this, so it followed the camera and stuck to whatever surface was detected.
This meant that we had a simple form of AR. However, as we are not experienced in Unity, setting up an entire application around it would be extremely time-consuming, so we decided that if Unity was going to be continued to develop, we would need a way to integrate it into our React Application.
React
As we had a base setup for a web-based react application, the first goal was to see whether we could get augmented reality working within this application. However, this application was Javascript based, we couldn’t just use the tutorials for Aframe and AR.js as these were HTML/CSS based.
After getting the camera to work somewhat, as it didn’t work on mobile yet, we started experimenting with a method to see whether we could get something to display. Things such as an Aframe package (Aframe-React, 2018)22 were not working, as nothing was showing up. Trying to get HTML code to work was also not having the desired effect.
Seeing as Unity was working, and during our search for ways to get AR in React we found a few packages that used Unity to display AR in React, we decided to focus on trying to integrate Unity into React.
For integrating Unity into React there are a variety of packages such as react-native-unity-view-reinvented ( React-Native-Unity-View-Reinvented, 2019)23, react-native-unity-view (Madsen, 2019/2023)24, react-native-unity (@azesmway/React-Native-Unity, 2022)25, react-native-unity-play ( React-Native-Unity-Play, 2021)26 and react-unity-webgl (React-Unity-Webgl, 2023)27. However, as soon as we started working on this, version conflicts started occurring. It appears that either the version of React we are working in was too new, or in general the ability to get Unity working in React was deprecated.
We got react-native-unity to somewhat work, in the sense that there were no version conflicts that broke the starting of the application, however in this case the importing of the Unity project was the problem. The Gradle kept not being able to reference the Unity project, despite us following multiple tutorials and troubleshooting and even creating a new project to keep the differences to the bare minimum. Nothing was working.
HTML/CSS and AR.JS
For AR.js we started by trying to do the location-based tutorials for AR.js (Image Tracking and Location-Based AR with A-Frame and AR.Js 3, n.d.).28. However, this didn’t appear to work as no matter what we tried, nothing was showing up on the screen, aside from the camera.
Based on this, we went ‘back to basics’ and worked on marker-based AR. As we could use it for the Poster Market and to see whether the most well-documented forms of AR did work. For this, we used the tutorial for MindAR (Build a Marker-Based AR App in 6 minutes | Source Code included | kandi tutorial, n.d.).29 This tutorial came with models and working code, which could be altered to fit our needs. Based on this application, after changing it to use our own marker and model, we were able to make a POC of marker-based AR.
However, though it meant that we could make AR work, it wasn’t useable for our application as that needed to be markerless. Based on that we started working on a location-based prototype. Around that same time, we got into contact with a teacher that is also working on AR, Bernd-Jan. He has been working on a location-based prototype. After finding that our testing phone was not ideal for AR, we decided to get a phone from the ISSD so we could focus on the software instead of the technology. We also got access to their location-based prototype, so we could experiment with it. Based on that we were able to make a location-based prototype and a relative to the user prototype.
Conclusion
Though there are a variety of options, based on our current needs and options that work, the best AR technique for right now is AR.js. It is the only one out of our options that works, despite our research saying it is not user-friendly to work with. We experienced that during the start-up phase, however, once we were able to get something to show, it was relatively easy to work with. It is free, online so it is widely available as long as your phone allows for AR and allows for easy integration into a web application.
Our version is best described as Markerless AR and could be specified as Location-based although it doesn’t fit the official description. If React or Unity work, it might be possible to create a downloadable application through them, however for now the AR.js application functions on both laptops and phones which is how we can make it the most accessible currently.
3. Artificial Intelligence
3.1 What data is available regarding this problem?
The exact process of gathering, preparing and exploring the data can be found in the Exploratory Data Analysis This will be a summary of this process.
The search for data had the following requirements:
- The data must be collected consistently, so we can see trends and outliers.
- The data must be collected regularly, so we can show the current amount of fine dust in the area.
- The data must contain some form of timestamp.
- The data must contain some form of location.
- The data must contain a measurement of fine dust, preferably PM1, PM2.5 and PM10.
Based on this, we will be using the real-time fine dust monitoring that was shared on the Eindhoven Open Data platform. This uses an API. The requests we used to gather this data used the format https://api.dustmonitoring.nl/v1/project(30)/location({location})/stream?$skip=77616. We can get all the locations from https://api.dustmonitoring.nl/v1/project(30)/locations, which gives a total of 49 locations.
A call gives the information in the following format: 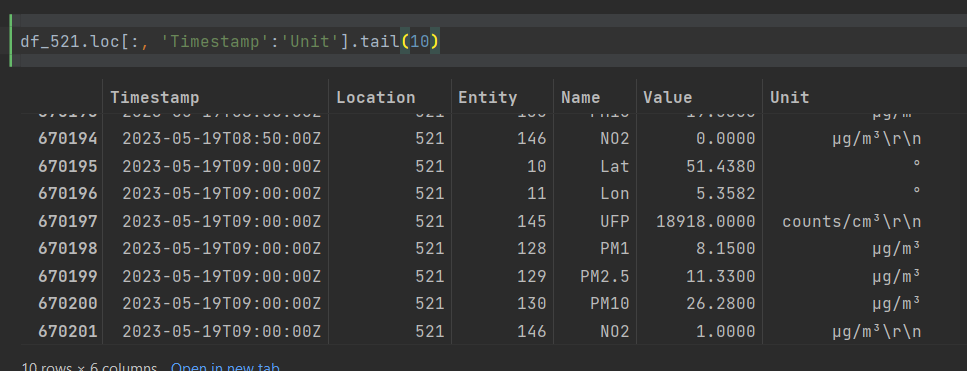
To make sure we only have the relevant information, grouped by the relevant timestamp and location, we prepare it so it looks as follows: 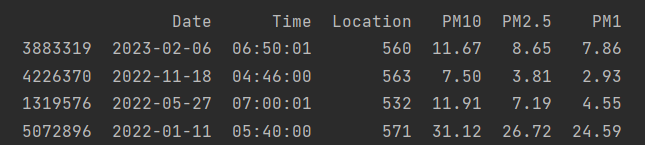
During the modelling we discovered to come close to a trustworthy model, we needed to group per hour and combine it with the weather data of Eindhoven. The data we are using from KNMI has 25 columns, and the API we later use also has a lot of features. We scoped it down towards the features associated with wind direction, average wind speed, precipitation per hour and temperature.
The weather data combined with our data, a sample of 5 looks as follows (along with datetime): 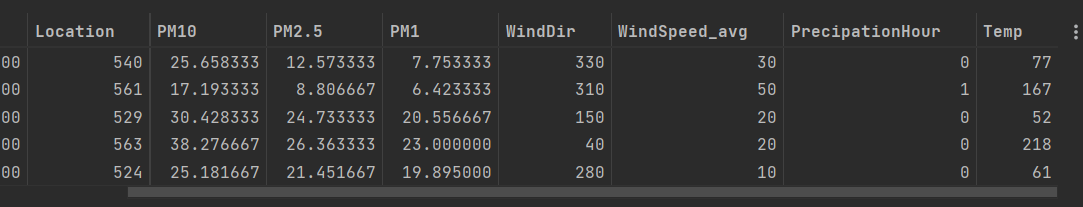
A single day of raw data from a location looks as follows: 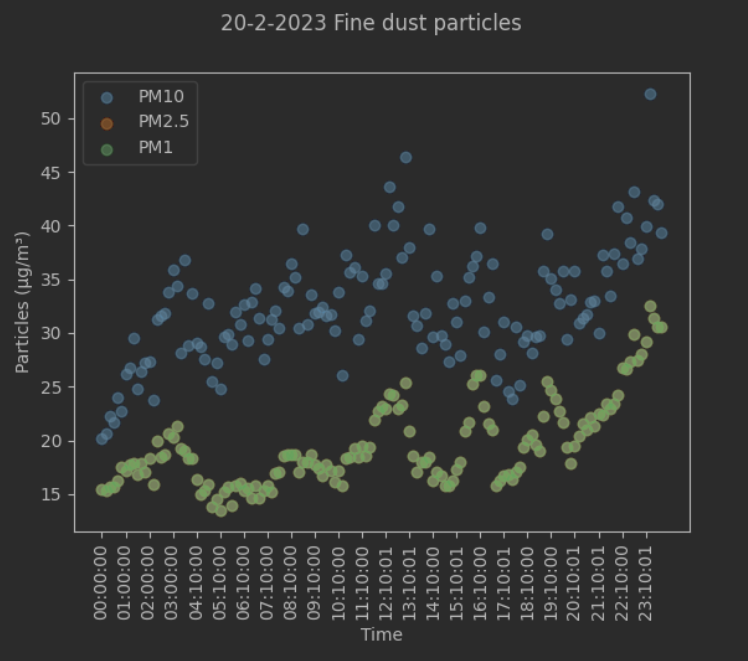 You can see clear correlations between the particle concentrations and trends in the data.
Originally, the data quality was decent, but not that great. The types matched, but there were some unexpected negative values. We believed that it was accurate as there are reputable organisations maintaining it. The consistency was good, the units and types were the same over 50 locations. The completeness of the data was not that great, there were no NaN values, but most locations were missing around 10% of data, with some even as much as 36%. The uniqueness is moderate, as there aren’t a lot of wide-scale similar datasets, however, samenmeten does have a similar dataset. The timeliness after the initial scraping of data is good.
We now know that the data quality improves once TNO will adjust their API. The negative values are being looked into by them, the completeness is partly because calibration measurements are also included and thus the periods between calibration and placement are also included. In combination with the fact that we group the data by hour, and thus only periods more than 1 hour of missing data form a problem for us this is not a big problem. To improve the uniqueness we could combine the data such as with the SensorCommunity. The timeliness is good seeing as we are now up to date with data.
3.2 How can AI be used to make predictions using this data?
The initial concept meant a time and location based prediction of fine dust. Based on a previous project where time series was used we tried multiple models to see which ones would be suitable for tuning.
ARIMA: 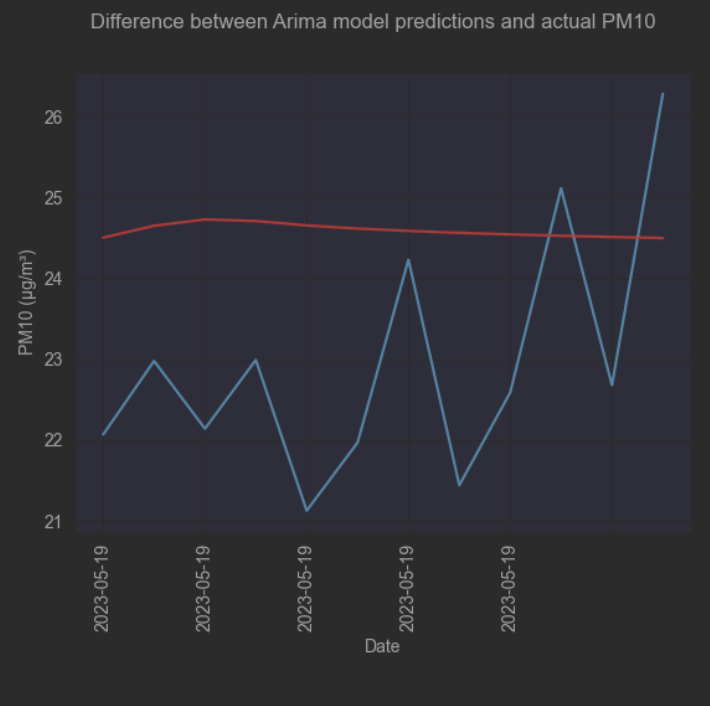
ETS: 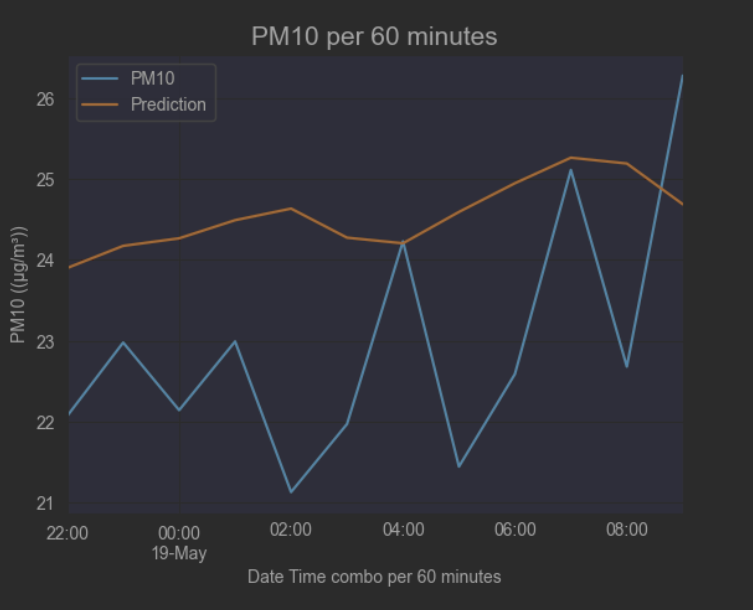
Prophet: 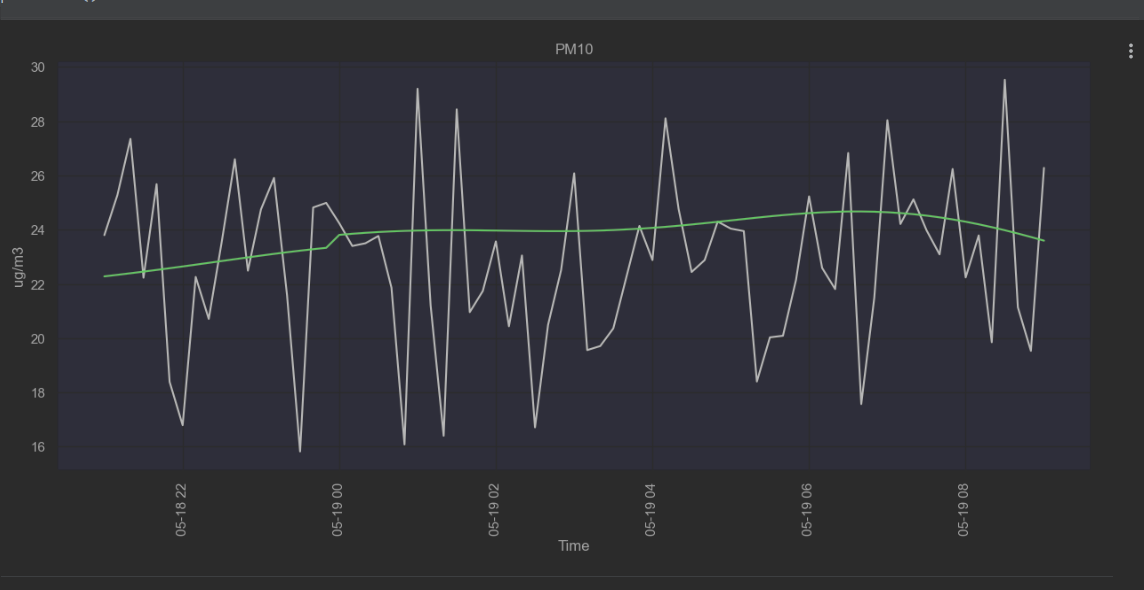
SNAIVE: 
Seasonal ARIMA: 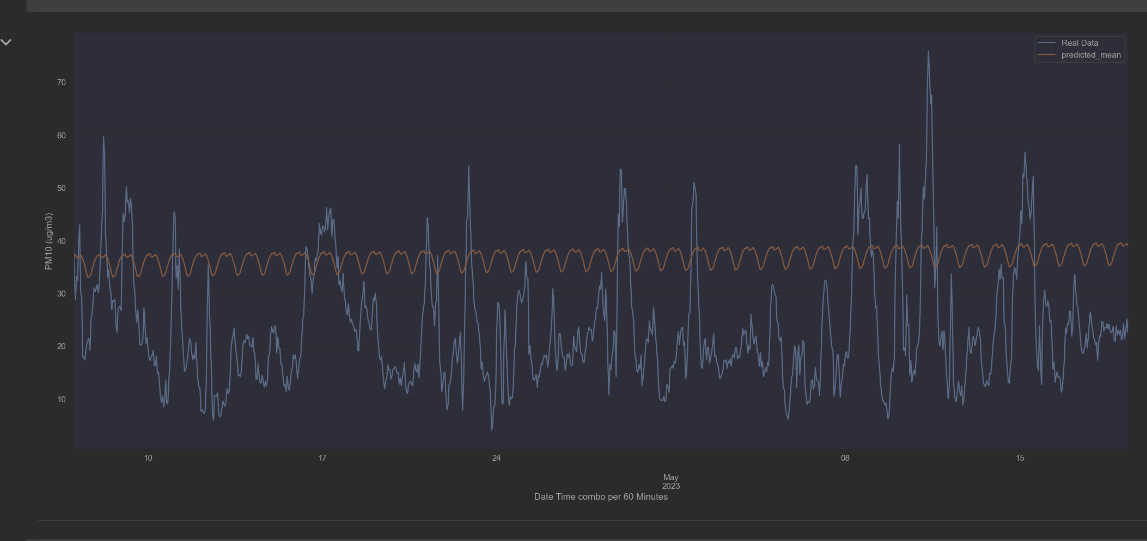
Polynomial Features: 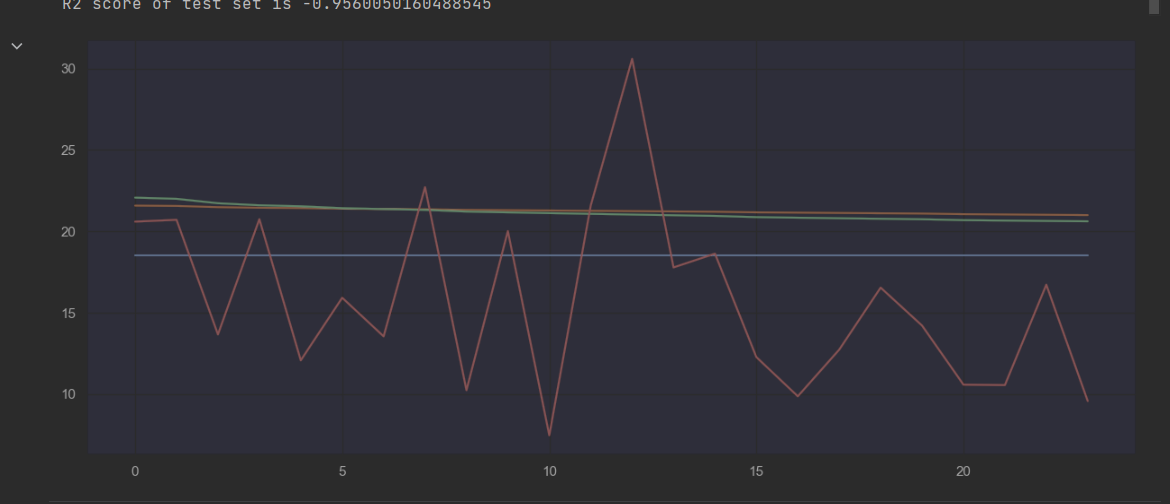
As you can see, they do not perform even close to a level that is acceptable. Most come close to a straight line. That is why we decided to add weather data to see how that would improve it. The only option for this was Prophet. For the weather data we used wind direction, wind speed, precipitation and temperature. This is based on the feedback from our expert Jean-Paul and from TNO. This produced the following results.
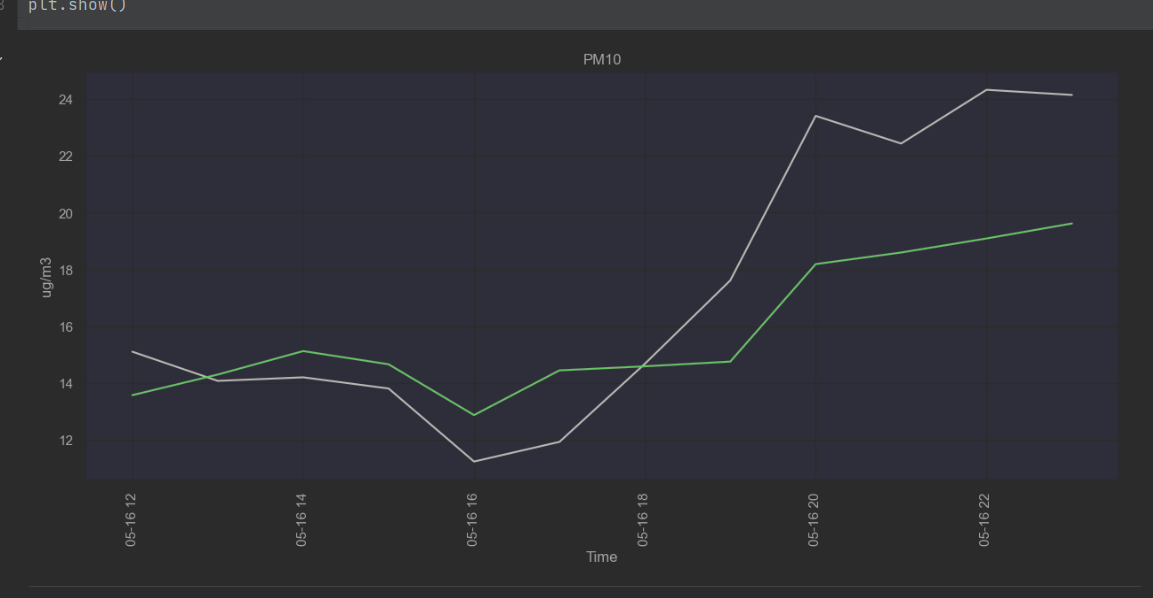
As you can see, this is close to the actual data. Of course it is not perfect, but seeing as the users will also not be standing on top of the sensor, the results will always be an approximation of the actual values.
Conclusion
Time series data alone are not sufficient to predict accurate results for fine dust. Combined with local weather data the predictions come close to the real data, as long as it is a prediction not too long after the historical data. That is also why the data will constantly need to be updated to be as accurate as possible. Using Prophet, data of fine dust per location grouped per hour and using local weather data can make predictions.
In the future other predictions might be able to be added, such as by adjusting the weather data features but for now a prediction of the concentration of PM10, PM2.5 and PM1 per hour on a location is the prediction that we know can be done based on the current data.
4. User Experience
4.1 What devices will the AR application be available on?
For this project, we wanted the application to be as accessible as possible. We knew we needed location data and access to the internet to make requests. Based on our previous research we made a web application, hosted on cdt.skylervermeer.nl so anyone who had a phone and internet would be able to visit the website. However, realistically this isn’t the case. Though AFrame, the method that we are using, works cross-platform(Introduction, n.d.)30, we also rely on WebXR to show the AR in the browser.
WebXR
As you can see below, a variety of browsers do not yet support WebXR. There are some, such as Safari that do not support it by default but where it can be enabled. These are the ones that have a green flag near them. This means that on desktop newer versions of Chrome, Edge and Opera support it, and Safari and Firefox only when you enable it. As for the mobile devices, arguably more important, Chrome, Samsung Internet and Opera mobile support it automatically, while Firefox for Android and KaiOS Browser only when enabled. (WebXR Device API | Can I Use… Support Tables for HTML5, CSS3, Etc, n.d.)31 This means that for Android there is quite a lot of support, however, iOS does not appear to be supported as of yet. 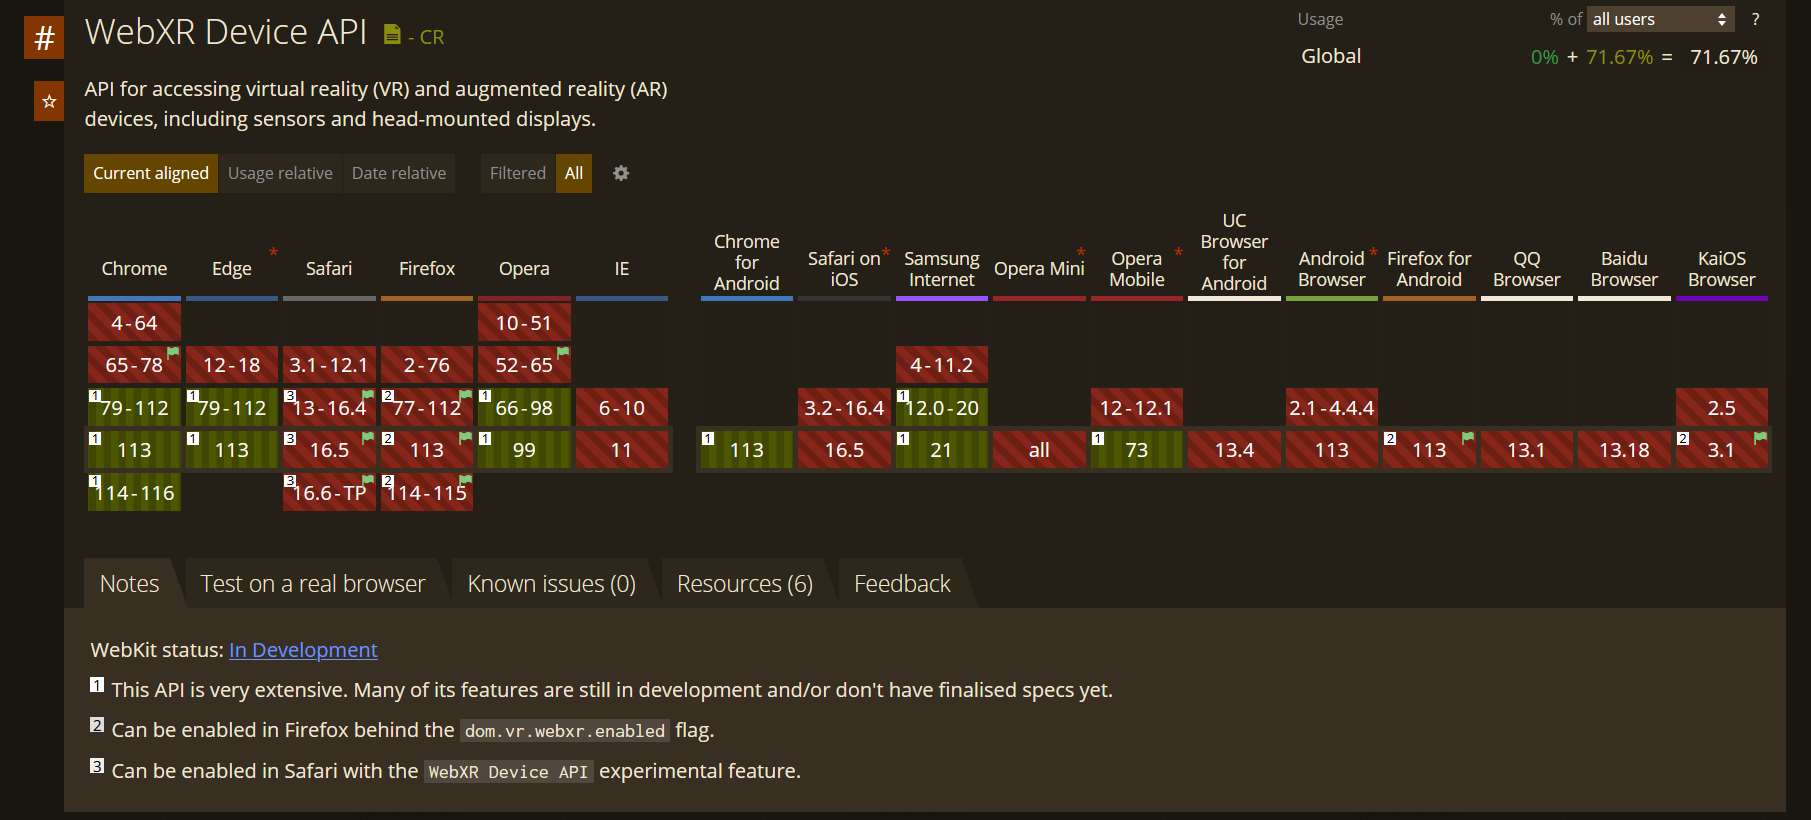
Performance
Due to it still being in development, the performance is not always great. The Samsung Galaxy A5 (2017) has stability issues. The Xiaomi Mi 10 Lite, launched in 2020, was used for testing due to its improvement on this stability front. Whereas a static location on the Galaxy would rotate out of view for the user, the Mi simply has a slight tremor.
Conclusion
The industry is constantly evolving and developing. Currently, the application seems to be supported on desktops for Chrome 79+, Edge 79+ and Opera 66+. On mobile it seems to be supported by Chrome 113, Samsung Internet 12.0+ and Opera Mobile 73. Older browsers are either not supported, or not supported by default so unless it is for development purposes they should be assumed not to be supported. That being said, even if the browser is supported, the phone might still be too old for stable AR. The differences in performance and browser compatibility should be addressed to improve the user experience.
4.2 How can it be verified whether users understand the severity of the city problem?
Though we cannot verify whether the user understands the severity of the city problem, we can use the feedback we obtained based on the several expos to verify whether users understand the concept, and what questions and concerns they currently have.
Based on the several feedback moments with Media students, the XR Event, the IT festival and the CDT webinar we were able to conclude a few things, as documented in the Feedback report.
Concept
The concept is good and liked. People are interested, want to know when they can use it, they like that it is more than a bunch of numbers. Some people related it to themselves, such as how they as a COPD patient can benefit from it. Some people supplemented additional use cases such as comparing long-term exposure rates. It was frequently compared to Buienradar.
Questions
There were a variety of questions, but they can mostly be summarized into a few general questions.
- What are people seeing, is it good or bad?
- What is the application meant for and/or how can people adjust their behaviour based on the application?
- Where is the application best used? These questions make the user understand the application better, making it easier for them to understand what they are seeing and draw conclusions.
Adjustments
Along with questions, a few adjustments were concluded based on this feedback so people understand the severity of the problem better.
- Add the ability for more sources, such as through the sensor community. This allows people to ‘personalise’ it because they can apply it to their own environment.
- A way for users to see how ‘accurate’ the visualization is. This is already in the designs but should be a priority in other iterations. These adjustments make it more personal for the user, increasing the severity as it now affects them.
Conclusion
The answer to the question ‘How can the severity of city problems in Eindhoven be visualized using AR in a way that is accessible and understandable to the users?’ can be partly answered. For this project, we essentially answered the question ‘How can the severity of fine dust in Eindhoven be visualized using AR in a way that is accessible and understandable to the users?’. Parts of the research, however, are relevant to all city problems of Eindhoven.
We have above concluded why we chose fine dust and why it is a problem. Based on this we created an application that can grow and be iterated upon to try and visualize the severity of fine dust in Eindhoven. The limiting factor is AR, as WebXR is not available on all devices. However, as time goes on this accessibility will increase. We have verified that the concept is understandable to the user and advised on how to improve this application to make it an even better answer to this question.
All in all, the severity of fine dust in Eindhoven can be visualized using AR in a way that is accessible and understandable to the users using future iterations of the application currently on cdt.skylervermeer.nl. Currently, the severity is not properly understandable and not accessible enough. With the processing of the advice report, this application should come close to being an answer to the research question.
References
-
Explore—Eindhoven Open Data. (n.d.). Retrieved 10 February 2023, from https://data.eindhoven.nl/explore/?refine.theme=Nature+and+environment&sort=modified ↩
-
Impacts of nature-based solutions on the urban atmospheric environment: A case study for Eindhoven, The Netherlands Elsevier Enhanced Reader. ( n.d.). https://doi.org/10.1016/j.ufug.2020.126870 ↩ ↩2
-
McDonald, R. I., Mansur, A. V., Ascensão, F., Colbert, M., Crossman, K., Elmqvist, T., Gonzalez, A., Güneralp, B., Haase, D., Hamann, M., Hillel, O., Huang, K., Kahnt, B., Maddox, D., Pacheco, A., Pereira, H. M., Seto, K. C., Simkin, R., Walsh, B., … Ziter, C. (2020). Research gaps in knowledge of the impact of urban growth on biodiversity. Nature Sustainability, 3(1), Article 1. https://doi.org/10.1038/s41893-019-0436-6 ↩
-
Pope, C. A., Ezzati, M., & Dockery, D. W. (2009). Fine Particulate Air Pollution and US County Life Expectancies. The New England Journal of Medicine, 360(4), 376–386. https://doi.org/10.1056/NEJMsa0805646 ↩
-
Wang, W., Cai, C., Lam, S. K., Liu, G., & Zhu, J. (2018). Elevated CO2 cannot compensate for japonica grain yield losses under increasing air temperature because of the decrease in spikelet density. European Journal of Agronomy, 99, 21–29. https://doi.org/10.1016/j.eja.2018.06.005 ↩
-
Chapter 1—Global Warming of 1.5 oC. (n.d.). Retrieved 13 February 2023, from https://www.ipcc.ch/sr15/chapter/chapter-1/ ↩
-
Climate Change: Global Sea Level NOAA Climate.gov. (n.d.). Retrieved 13 February 2023, from http://www.climate.gov/news-features/understanding-climate/climate-change-global-sea-level ↩
-
Hooper, D. U., Adair, E. C., Cardinale, B. J., Byrnes, J. E. K., Hungate, B. A., Matulich, K. L., Gonzalez, A., Duffy, J. E., Gamfeldt, L., & O’Connor, M. I. (2012). A global synthesis reveals biodiversity loss as a major driver of ecosystem change. Nature, 486(7401), 105–108. https://doi.org/10.1038/nature11118 ↩
-
Cardinale, B. J., Duffy, J. E., Gonzalez, A., Hooper, D. U., Perrings, C., Venail, P., Narwani, A., Mace, G. M., Tilman, D., Wardle, D. A., Kinzig, A. P., Daily, G. C., Loreau, M., Grace, J. B., Larigauderie, A., Srivastava, D. S., & Naeem, S. (2012). Biodiversity loss and its impact on humanity. Nature, 486(7401), 59–67. https://doi.org/10.1038/nature11148 ↩
-
Otjes, R., & Close, J. P. (Directors). (2023, February 8). STAD VAN MORGEN - Special Guest: René Otjes—08.02.2023 HQ. In Stad van Morgen. RARARADIO. https://www.mixcloud.com/RARARADIO_EHV/stad-van-morgen-special-guest-rené-otjes-08022023/?play=fb ↩
-
Ritz, B., Hoffmann, B., & Peters, A. (2019). The Effects of Fine Dust, Ozone, and Nitrogen Dioxide on Health. Deutsches Ärzteblatt International, 116(51–52), 881–886. https://doi.org/10.3238/arztebl.2019.0881 ↩
-
Carmigniani, J., & Furht, B. (2011). Augmented Reality: An Overview. In B. Furht (Ed.), Handbook of Augmented Reality (pp. 3–46). Springer New York. https://doi.org/10.1007/978-1-4614-0064-6_1 ↩
-
Frontend. (n.d.). Retrieved 6 March 2023, from https://itouchi.github.io/ ↩ ↩2
-
Boonbrahm, S., Boonbrahm, P., & Kaewrat, C. (2020). The Use of Marker-Based Augmented Reality in Space Measurement. Procedia Manufacturing, 42, 337–343. https://doi.org/10.1016/j.promfg.2020.02.081 ↩ ↩2
-
Ahmed, M. N. (2016). Face Detection based Attendance marking System.. https://www.researchgate.net/profile/Varsha-H-S/publication/337672627_Face_Detection_based_Attendance_marking_System/links/5de4ab4492851c83645a14d5/Face-Detection-based-Attendance-marking-System.pdf ↩
-
Moghtadaiee, V., Dempster, A. G., & Lim, S. (2011). Indoor localization using FM radio signals: A fingerprinting approach. 2011 International Conference on Indoor Positioning and Indoor Navigation, 1–7. https://doi.org/10.1109/IPIN.2011.6071932 ↩
-
Chong, T. J., Tang, X. J., Leng, C. H., Yogeswaran, M., Ng, O. E., & Chong, Y. Z. (2015). Sensor Technologies and Simultaneous Localization and Mapping (SLAM). Procedia Computer Science, 76, 174–179. https://doi.org/10.1016/j.procs.2015.12.336 ↩
-
Paucher, R., & Turk, M. (2010). Location-based augmented reality on mobile phones. 2010 IEEE Computer Society Conference on Computer Vision and Pattern Recognition - Workshops, 9–16. https://doi.org/10.1109/CVPRW.2010.5543249 ↩
-
Behringer, R., Klinker, G., & Mizell, D. (1999). Augmented Reality: Placing Artificial Objects in Real Scenes. CRC Press. ↩
-
Create an AR game using Unity’s AR Foundation. (n.d.). Google Codelabs. Retrieved 7 March 2023, from https://codelabs.developers.google.com/arcore-unity-ar-foundation. ↩
-
Indra M (Director). (2022, June 8). Create an AR game using Unity’s AR Foundation (Car Driving) | Unity 2020 ( Codelab Tutorial). https://www.youtube.com/watch?v=-wWOktZCSX0 ↩
-
Aframe-react. (2018, February 12). Npm. https://www.npmjs.com/package/aframe-react ↩
-
React-native-unity-view-reinvented. (2019, December 2). Npm. https://www.npmjs.com/package/react-native-unity-view-reinvented ↩
-
Madsen, A. S. (2023). React-native-unity-view [C#]. https://github.com/asmadsen/react-native-unity-view ( Original work published 2019) ↩
-
@azesmway/react-native-unity. (2022, November 25). Npm. https://www.npmjs.com/package/@azesmway/react-native-unity ↩
-
React-native-unity-play. (2021, June 7). Npm. https://www.npmjs.com/package/react-native-unity-play ↩
-
React-unity-webgl. (2023, January 6). Npm. https://www.npmjs.com/package/react-unity-webgl ↩
-
Image Tracking and Location-Based AR with A-Frame and AR.js 3. (n.d.). A-Frame. Retrieved 20 April 2023, from https://aframe.io ↩
-
Build a Marker-Based AR App in 6 minutes | Source Code included | kandi tutorial. (n.d.). Retrieved 20 April 2023, from https://www.youtube.com/watch?v=iSIj2KFwVT4 ↩
-
Introduction. (n.d.). A-Frame. Retrieved 5 June 2023, from https://aframe.io ↩
-
WebXR Device API Can I use… Support tables for HTML5, CSS3, etc. (n.d.). Retrieved 5 June 2023, from https://caniuse.com/webxr ↩