Portfolio - A(I)R Zoom Lens
Fontys Lectorate High Tech Embedded Systems Eindhoven
Eindhoven
| Date | June 8th 2023 |
|---|---|
| Version | 2.3.2 |
| Status | Finished Draft |
| Author | Skyler Vermeer |
Document History
Version
| Version | Date | Author | Amendments | Status |
|---|---|---|---|---|
| 0.1.0 | 07-02-2023 | Skyler Vermeer | Layout | Layout |
| 1.0.0 | 06-04-2023 | Skyler Vermeer | Inputted actual learning outcomes + started filling in current information | First Draft |
| 1.1.0 | 13-04-2023 | Skyler Vermeer | Reformatting layout according to comeback day overview + adding research questions, approach and start of Process | First Draft |
| 1.2.0 | 30-05-2023 | Skyler Vermeer | Professional duties analysis, design, realize | First Draft |
| 1.3.0 | 31-05-2023 | Skyler Vermeer | Professional duties Advice, manage and control, situation orientation, personal goals, investigative problem solving | First Draft |
| 1.4.0 | 01-06-2023 | Skyler Vermeer | Personal leadership, targeted interaction, personal goals | First Draft |
| 1.5.0 | 07-06-2023 | Skyler Vermeer | Added some images, removed some unknowns, expanded practical research, results, conclusions and recommendations | Finished Draft |
| 1.5.1 | 08-06-2023 | Skyler Vermeer | Updated some versioning, add some links | Finished Draft |
Communication
| Version | Date | To |
|---|---|---|
| 1.4.0 | 02-06-2023 | Frank Schürgers |
| XXX | xxxx | xxxx |
Introduction
xxxx
Table of Contents
The Assignment
Context
The Lectorate ‘High Tech Embedded Software’ from Fontys HBO ICT researches methods and techniques to enhance software development for smart high-tech embedded systems.
The project concerned the Digital Twin Academy, City Digital Twin specifically, which conducts case studies on digital twins to enrich open data of air quality with public area info and other data sources to define useful eco-score.
Problem
One of the biggest problems with the most wicked city problems like air pollution or biodiversity loss is that people are not aware of their seriousness, which is why the City Digital Twin project wants to make this more tangible.
Goals
The goal of this project was to make the seriousness of the most wicked city problems more tangible. The desired product was an application that uses Augmented Reality to visualize location-based data in such a way that it is understandable to the people at that location.
It is possible to make Digital Twins of cities for specific contexts and goals. One of these is informative visualizations, which is what our project consists of. This project should both work towards its goal of making an informative visualization of city problems, as well as be useful for future City Digital Twin projects.
Research Questions
For this project, the main research question is: “How can the severity of city problems in Eindhoven be visualized using AR in a way that is accessible and understandable to the users?”
The key questions that are the foundation of this project in answering the main question are the following:
- Which city problems are being monitored in Eindhoven?
- What impact do these city problems make?
- How can this problem be visualized?
- What is the best Augmented Reality technique for this application?
- What data is available regarding this problem?
- How can AI be used to make predictions using this data?
- What devices will the AR application be available on?
- How can it be verified whether users understand the severity of the city problem?
Approach
The approach for this project was a combination of Agile and Waterfall. At the start, the research would be done using a waterfall approach, and once the iterative stage in the project was reached this waterfall approach would be combined with an Agile approach. It would consist of a total of five phases:
Phase 1 - Problem Definition
Phase 2 - Research and Experiment
Phase 3 - Component Development
Phase 4 - Combined Development
Phase 5 - Finalize
Process and Results
Structure
To start this project, I set up a structure so I had a clear overview of what needed to be done, a git repository for version control and easy sharing and could also identify areas that I was not sure yet what was expected of me.
For this project, I decided to use Obsidian, which is a markdown editor with a variety of features. The initial features that stood out to me were easy linking between documents, graph view allowing me to see how documents (and research) were connected, the ability to install plugins, the ability to create templates for documents easily and by using markdown the files would be easily viewable in git.
Based on my documentation from previous semesters I created a template for my documentation, used them for each of the planned documents, and adjusted them to match the relevant document better.
I also created a to-do list so I had a better overview of important tasks that needed to be done. Later, I moved this over to Trello, so I could also filter my tasks and make them more visible to myself. I created 3 boards for this: Documentation, Development and Milestones. Documentation was to break down the documentation into bite-sized tasks and make sure I process the information such as expert interviews and feedback. It had the sections ‘To Do’, ‘Doing’ and ‘Waiting on Verification’, and ‘Done’. I also added tags such as ‘waiting on other task’, ‘High Priority’, and ‘Need Help’ to better identify why I hadn’t done a task or which task had priority. 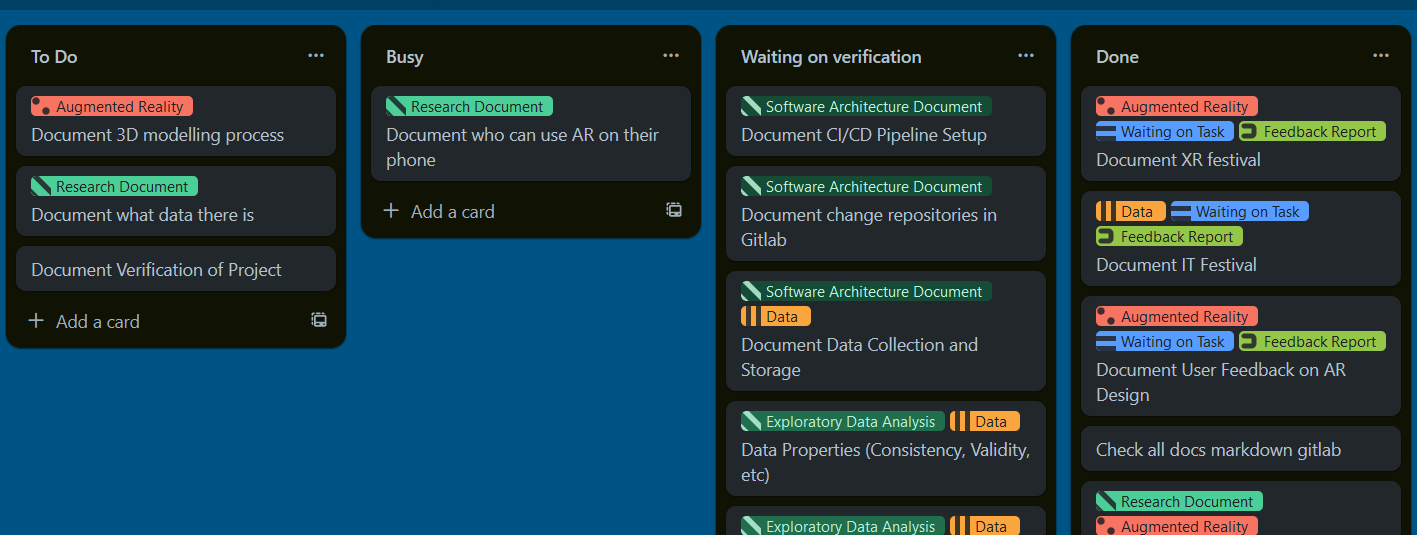 Development had a similar setup but was meant more for concrete tasks such as scraping data, testing, developing a feature, designing etc.
  Milestones were meant to keep me on track, make sure I have all the approvals I need, and all the documents I need, and had tasks such as ‘Prediction Chosen’. These tasks are paired with the phases they are associated with, as described in the approach section.
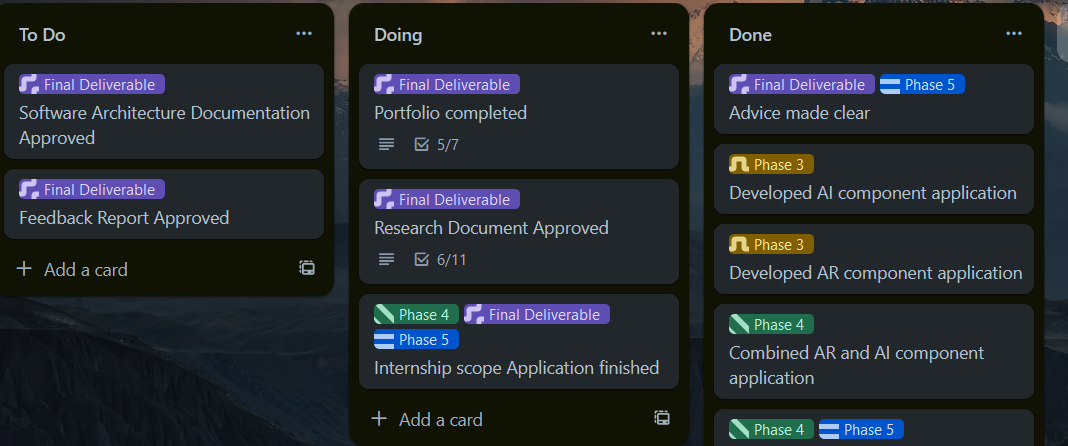
For the Git Repository, I used the FHICT Gitlab, allowing my company coach and assessors easy access, easy display of markdown and easier transferring if the project continued. Initially, I had a single repository, however, I noticed that if I was experimenting and wanted to work in branches, this meant I could not for example do my documentation because the experimentation branch was multiple commits behind the experimentation branch, and if I had something that was running for a while, I couldn’t just switch branches as that would remove the progress. To fix this issue, once the progress allowed for it, I set up 3 repositories: cdt-a-i-r-zoom-lens-documentation , cdt-a-i-r-zoom-lens-front-end and cdt-a-i-r-zoom-lens-back-end. This way I would always have access to my documentation, and my front end, consisting of Augmented Reality and such was separated from my back end, consisting of my data analysis and modelling. These repositories were also shared with my company coach, Simona, so she could see my progress and do her own experimenting when needed.
Problem definition
The next aspect was to define the problem. To start this, I transferred my Project Proposal into my Project Plan. Based on this I knew I needed to scope down my project to a single city problem. That is why I did initial research to answer the questions: “Which city problems are being monitored in Eindhoven?” and “What impact do these city problems make?”. For this, I did literary research which was documented in the Research Document, specifically 1.1 and 1.2. I started the research off by looking at which problems were noted in the Eindhoven Open Data portal, and connecting these to their origins: Population Growth and Urban Growth. Next, I started looking more into the impact of these problems and documenting this. Based on this research, I made a SWOT analysis of the different problems to see which would be the best to scope our project on.
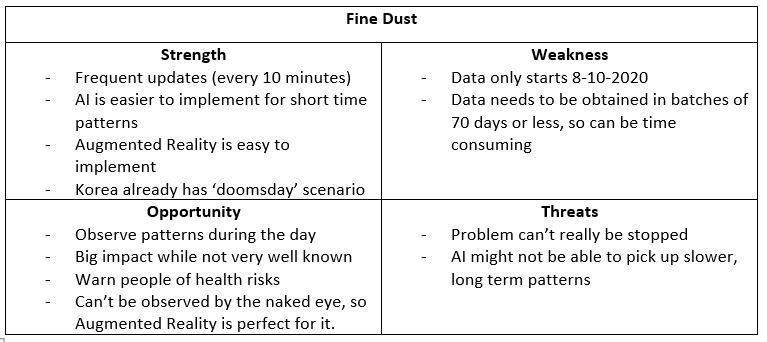
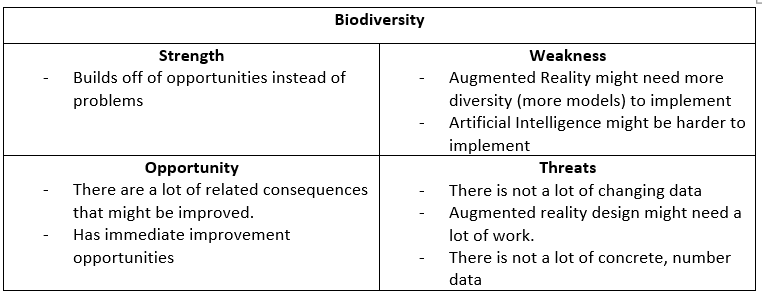
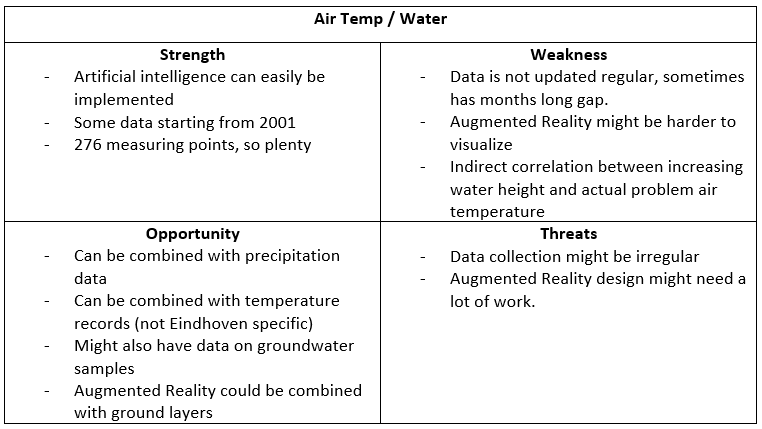
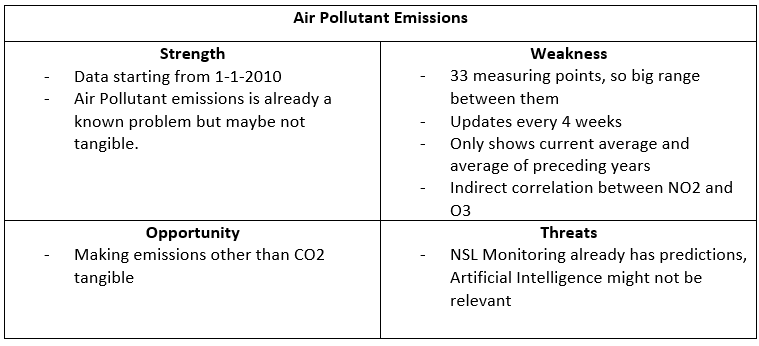
Based on this, together with Simona, I decided that Fine Dust was the best choice to move forward, as this was the one with the most potential for success and would incorporate AR and AI the best. The complete breakdown of this decision-making process can be found in the conclusion of chapter 1 of the Research Document.
I was planning to make a requirement prioritization as indicated in the project plan, but during the research the priorities kept shifting as we discovered more and more things that we needed clarification on so I resorted to just discussing the current priorities with my company coach during our weekly meetings.
Theoretical / Domain Research
Now I knew what problem I was going to be tackling, I was going to need more knowledge on a variety of subjects. Particularly, Augmented Reality and Fine Dust. Though there was enough information to choose Fine Dust as the scope, to be able to make it more tangible more knowledge on the subject was needed. As for Augmented Reality, more knowledge was needed on what it was and what choices needed to be made. That is why Simona invited Jean-Paul Close to join our project as an expert. After talking to him, I documented my findings in the Research Document, under 1.2 What impact do these city problems make?, and noted him as the source.
Based on the recommendation of my first assessor, I contacted Aytaç Sarkmaz for his research on Augmented Reality so I could scope the different types of augmented reality and the different frameworks and platforms. I combined this with more literature research on Augmented Reality in general and on the types where applicable and documented this in the Research Document, under 2.2 What is the best Augmented Reality technique for this application?.
Later on in the project, after the key development decisions were made I also researched what devices the AR application will be available on. It is currently supported on browsers on newer versions of Android but not iOS. All this research can be found at 4.1 What devices will the AR application be available on?
Practical Research
As for the more practical research, I used several methods. I supported the choice of the Augmented Reality technique by using several Proof of Concepts to see which aspects worked and didn’t work. These can be found here: React Application, React Unity Combo, HTML/CSS (multiple)
I also answered research question 2.1 How can this problem be visualized? in the Research Document. For this, I created sketches and discussed them with my stakeholder. After that, I created a clickable wireframe and tested this with Semester 6 Media students. Initially, the goal was to use a survey and test it with the visitors at the poster market, however, the attendance at this event was not as high as expected and thus I had to resort to Media students. Based on their feedback, I updated my designs and then verified them with my company coach and the expert.
Based on these verified designs, I started developing the application using HTML, CSS and Javascript in combination with AR.js and Aframe. I created some custom models, so I could test the application using a custom model instead of the built-in features such as a-plane. I used Blender for this as this is an application I was already somewhat familiar with. 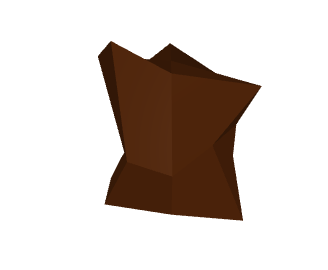 The model was a good recognizable model for the development, but it didn’t look good so when the problem of the weight of Fine Dust came up, I decided together with Simona to go for brightly coloured sphere’s scaled to the particle.
  Around this same time the visual was adjusted to have the sphere’s depicted on a plane instead of flying around, to make it easier to position and see.
Another important aspect of this project was the data that needed to be visualized. Once the decision was made which problem we were going to be researching, I started looking at how I could obtain the data. The download would require a manual download of every location separately, per 70 days. This was not feasible so I started using the API.
I should have scraped a small timeframe or one or two locations, but I decided to create a loop that would scrape all the available locations from their original date to the current date. These requests were per 10 minutes, with longitude, latitude, NO2, PM10, PM2.5, PM1 and UFP separate in batches of 144. This means that approximately 3,5 hours were sent per request. This took a while, as it had to be done per location and the API crashed repeatedly. Luckily I did this over spring break so I wasn’t waiting on the data and I could also work on some of the research in the meantime.
Once the data was in, I could start exploring it. I started with one single location, and started preparing it as I wanted all the measurements grouped per time it was measured. I also checked whether all the units were the same, and checked that the longitude and latitude values were not trustworthy as the most commonly provided location was not the actual location it was placed.
I visualized a single day to see any patterns or outliers. 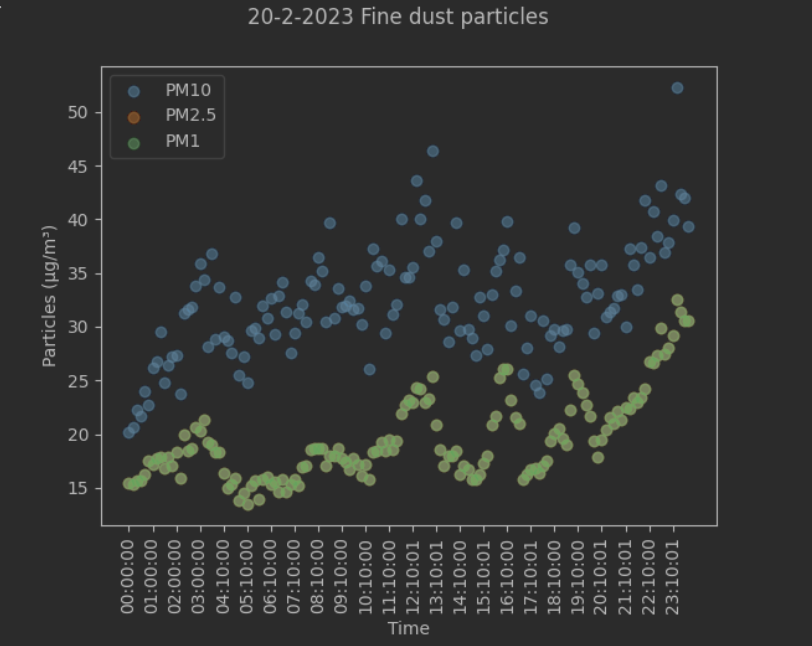 A clear correlation between the PM values is visible, and PM2.5 and PM1 seem exactly the same, but I checked and there is a difference, but on the scale with PM10 it is not very visible. I continued checking from various perspectives, such as decomposing the time series but I didn’t observe a lot of actual trends and seasonality.
Based on this Simona obtained a report1 from TNO about these sensors. I started comparing my data to this report, and started finding inconsistencies that I couldn’t explain. Based on this we contacted TNO and they could explain some inconsistencies due to actions I had not taken such as only using data that had collected data for 75% of the timeframe that was being looked at. Other inconsistencies were not explained by them, so we set up an in person meeting. Based on this meeting there were a few things that TNO was unaware of, and a few advices and feedbacks I had gotten and I continued based on that.
Based on the knowledge acquired through the EDA, the expert and TNO I started modelling using time series and later on also including weather data. Based on this I only found Prophet to be a suitable model as the other ones practically drew straight lines, ignoring the seasonality in the data. Prophet: 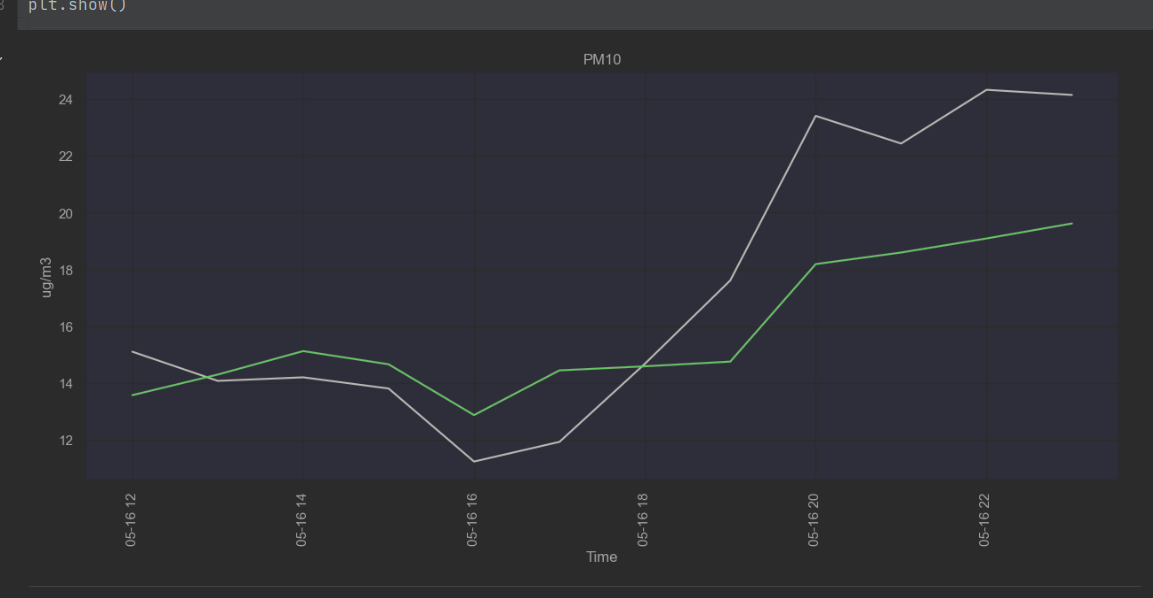 Example of a different model:
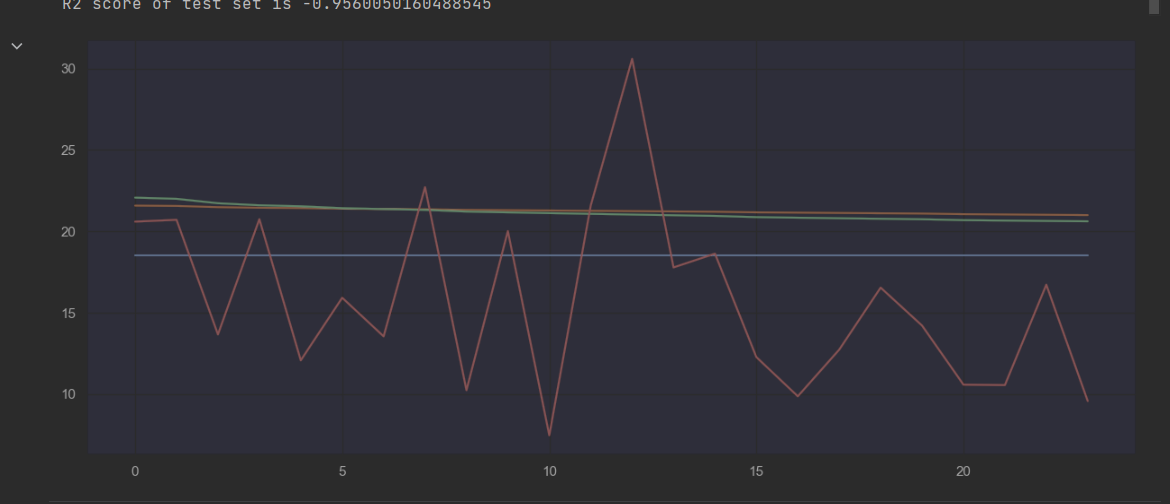
Nearing the end of the project, in May and June, there were several expos that I was invited to share my project at. The XR event, the IT festival and the CDT webinar. As all of these things had a different focus, this became the deadline for the development of each of these focuses. The XR event meant that I needed a functioning AR component, which I succeeded at. The IT festival meant that I needed an implemented AI component, which I also succeeded at and the CDT festival was the combination of the two, however seeing as I had already accomplished that during the IT festival, I focused on a finished advice here.
Based on the feedback I received at these events, and processing it in the Feedback report, I composed an Advice Report that detailed what the feedback revealed which could not be processed during the current project.
Results
The results of my research are visible in the following documents:
- Project Plan
- Exploratory Data Analysis
- Modelling Notebook
- Software Architecture Documentation
- Research Document
- Feedback Report
- Advice Report
All research and code can be found on the documentation git , the front-end git and the back-end git. The deployed version of the application can be found on cdt.skylervermeer.nl.
Conclusions
As detailed in the conclusion of the Research Document, the severity of fine dust in Eindhoven can be visualized using AR in a way that is accessible and understandable to the users using future iterations of the application currently on cdt.skylervermeer.nl. Currently the severity is not properly understandable and not accessible enough. With the processing of the advice report, this application should come close to being an answer to the research question.
Recommendations
For the recommendations, I refer you to the Advice Report.
Personal Reflection
Professional Duties
You carry out the professional duties on a junior bachelor level resulting in professional products in line with the IT-area you are working in.
In the section below I will detail which products I delivered and how they relate to the HBO-i contexts Analysis, Design, Realize, Advise and Manage&Control
Analysis
A lot of this project was analysis. There was a lot of literature research and data analysis. Essentially, the project was analysing the problem and advising on the solution based on a prototype.
For this section I will be focusing on the Research Document and the EDA. These are the two documents that display the Analysis component the most. This doesn’t mean that there were no other analyses, but these were the most important ones.
The first aspect I analysed were the problems in Eindhoven. This analysis was based around the problems that were on the Eindhoven Open Data portal, and connecting these to their origins: Population Growth and Urban Growth. Using Literature Analysis I managed to make a comprehensive analysis of the problems and using SWOT I was able to choose a problem to scope the project with. My company coach thought that I made a clear, useful and educational overview of the city problems and agreed that I made it clear why I chose Fine Dust.  . Of course, I also processed the feedback about the structure for 1.2. I believe that I did an extremely good job at this analysis. Of course, not everyone will be able to comprehend the research. However, anyone who is working on the project will be up to speed on the different problems, their origins, why it is a problem and why we chose fine dust. It uses multiple techniques, literature research, expert interviews and SWOT analysis, and is still properly scoped.
For the visualization aspect, aside from the designs I also researched Augmented Reality, analysed the different methods and frameworks to advice on the best one. For this, I scoped the techniques and frameworks using the research of Aytaç Sarkmaz. After I did this analysis, I moved towards testing my preferred methods. The practical research revealed that I needed to re-analyse as the advice from the initial analysis wasn’t working. I believe I could have been more concise with my research, as it didn’t need as much time spent on it. However, with the time that was spent on it, I believe I gave a clear overview of our choices and what we based our decisions on. Essentially, it was a bigger analysis than needed but the content is up to standards.
The Exploratory Data Analysis was a feat in itself. Though it isn’t up to my usual standards of an EDA, a detailed, transparent, reproducible analysis on several levels of the data, this had a valid reason. Due to the inconsistencies in the data from TNO, we needed to shift our focus to the report that TNO made on this same data. It is always good to analyse the data yourself, but after our findings weren’t consistent with our theoretical knowledge we decided to compare it to the report of TNO. This revealed even more inconsistencies which shifted the focus of our project towards trying to figure out what inconsistencies we could find and discuss them with TNO. Initially we analysed the raw data of a single location. This revealed some long periods of time when there was no data recorded and a few spikes. Between PM2.5 and PM1 there was limited difference visible in comparison to PM10. After a basic analysis of a single location, we decided to combine the locations to see if we can observe patterns from there. Here we also find some irregularities so we decided to pivot towards comparing it to the TNO report. This analysis of the TNO report was a valuable addition to both the City Digital Twin project, our expert Jean-Paul and TNO itself. For the CDT project, it was useful as it showed irregularities in otherwise trusted data. Jean-Paul is part of the maintenance of the network and they were unaware of the inconsistencies of the TNO API, whether they were a problem at sensor level or API level. For TNO it was interesting as they too were unaware that there were problems within the API, as well as with the location data that was shared online. The analysis isn’t perfect, but it was mainly meant to be a quick way of communication. Simona also noted that this EDA was good and that I didn’t need to work on reordering, improving and expanding it. If I had more time, I would have highlighted the differences between the airport, urban and agricultural groups. I would also have reevaluated the data quality after the insights from TNO and prepared the data in such a way that the data from TNO only is the correct data. A heatmap of the different locations would also be an interesting visualization. All in all there are plenty of ways the EDA could have been expanded, but within the time scope of the project, this is the final result. It is a valued analysis of the data, including a comparison to the TNO report.
Based on this analysis we contacted TNO and after a meeting we focused on modelling. Here there was an analysis as well, which model was the best fit for the project. For this we analysed ARIMA, ETS, PROPHET, SNAIVE, Seasonal ARIMA and Polynomial features. I did this based on a previous project from semester 4 which also uses time series. The Polynomial Features were added on advice of Simona. The selection of different models is extensive, however the descriptions and annotations of the results are minimal. The modelling analysis could have been expanded with different levels of grouping, such as every hour, every two hours, short-term predictions, long-term predictions and the likes. The model that is currently there is good and functions as intended and it is clear why it is chosen. However, it is by no means a complete analysis.
Design
I designed an application, sketching, then showing it to semester 6 Media students and improving it. 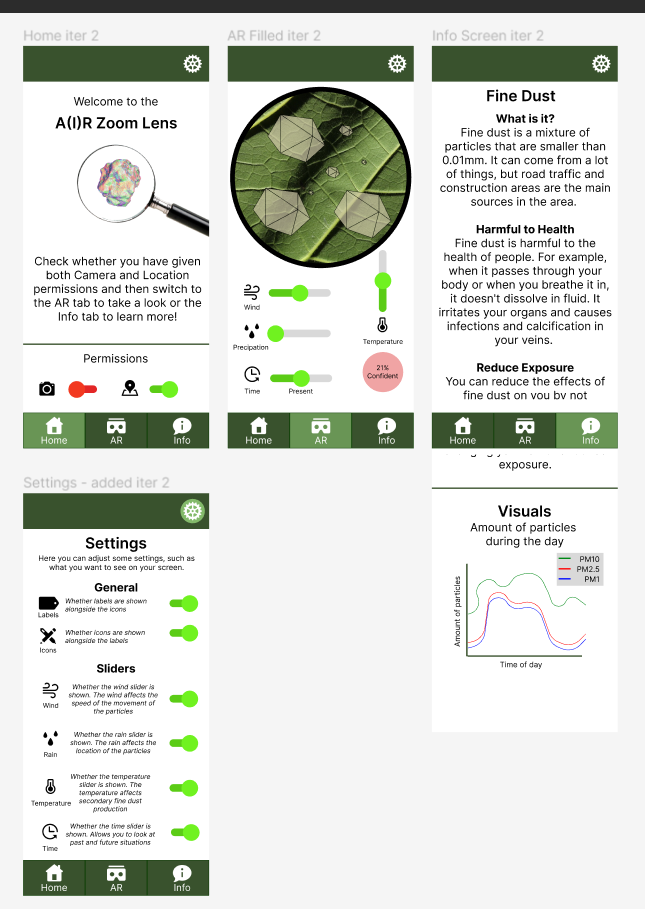 With my current knowledge level, experience and scope, these are quite good designs. I have gone through several iterations, tested them, and verified them with my company coach, users and design experts. I could have focused more on the designs, only creating a prototype, but seeing as I also needed to incorporate AR and AI, with the current scope this level of design is optimal. I have already advised future designers based on the feedback that was received so they could focus on it completely, not having to worry about the integration of the different components or using mock data but simply improving the front-end designs.
I also designed the software architecture that has a front-end, a back-end that uses an API and that connects to the external API’s such as from TNO. There was no existing system, but the way I built this system it is scalable and can integrate new components quickly. It isn’t the optimal system, as a second storage system is most likely needed, but it is a flexible, scalable system that is easy to use and continue with. 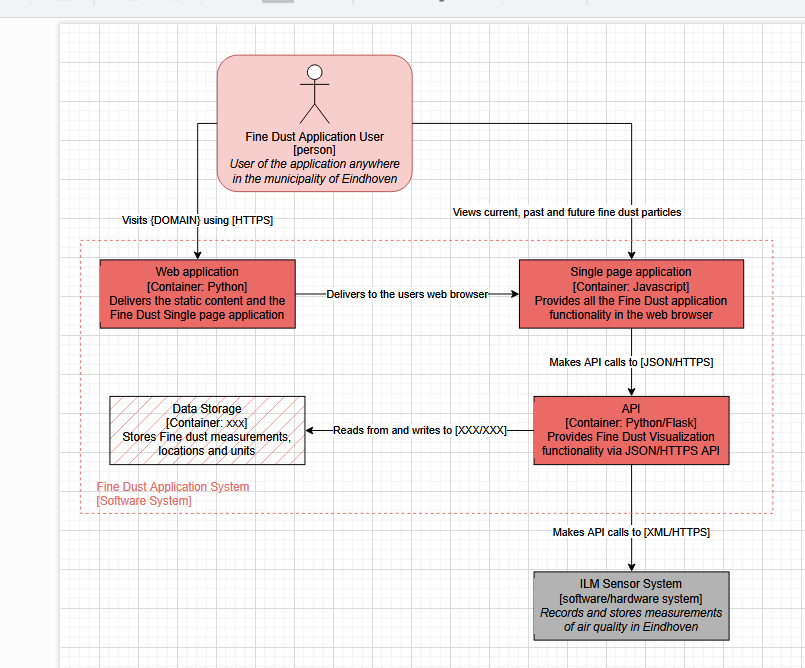
Realize
In my Feedback Report I have shown several demo’s of the realized prototype, and the feedback I have obtained on it. It is not complete, but in my Advice Report I have also detailed aspects that still need to be done and how it can be done. The front-end can be found at cdt.skylervermeer.nl and under the subdomain cdt-api.skylervermeer.nl the API is hosted.
Due to the XR event being a deadline for an integrated AR component, and the IT festival being the deadline for the integrated AI component the application was fully realized on May 23rd. The scope of the project was completed, though the exact interpretation of the scope, the planning so to say, was updated throughout the semester. The project was realized, and documented fully in such a way that students could easily continue the project simply by reading the documentation.
I am proud that I was able to complete the project in such a way that there is a functional product with full potential for continuance including the research to back up the choices. This is something that I often struggle with, finding a proper point to stop. The fact that I managed to do it this early in the semester is admirable.
Advise
Though I have advised smaller sections throughout the project, mostly during the conclusions of chapters, my main advise is visible in the Advice Report. In this report I advise future project members on how to continue the project, dividing it up into the sections research, design and functionality. I also have identified the student groups that would be a best fit for each subsection. I have done this advice based on conclusions of research, items that fell outside of the adjusted scope and acknowledging my own expertise while also identifying areas in the project that need to be improved.
Alongside with that, I have also advised future project members in the Software Architecture Documentation on how they should proceed during development, initially using the current repository, then when a new server is set up transferring it to the new repository and server. This allows students to continue with the project with minimal effort.
Manage & Control
For Manage & Control, I have detailed my process in the Software Architecture Documentation. In this document, I detail for the current contexts, the data, the CI/CD and for future development what steps I have taken and what steps other members might need to take. I have set up the project in such a way that it is easy to manage for me and easy to continue for future users. I am as transparent as possible and designed the project and application to be scalable. The biggest factor in this is the CI/CD pipeline. 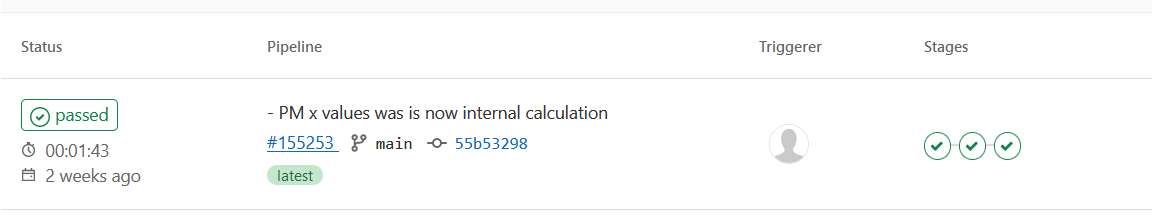 First, the image gets created based on (a directory in) the repository. Then SonarQube does a scan, and we can add ‘requirements’ to this scan, such as that it will fail and stop the pipeline if there are too many code smells. Then, the application gets pushed to the docker repository and to the server so it is automatically updated. This can be done by anyone who has permission to push to the repository. This helped me, as the project needs to be hosted on a server due to it needing HTTPS and CORS requiring a pre-determined domain. It allowed me to not have to worry about pushing and pulling the container, simply focussing on pushing the new commit and seeing whether the pipeline succeeds.
Situation-orientation
There is no doubt whether I delivered relevant results for the project and company. Though I wasn’t able to create a fully functional application, all my research and insights and current progress are highly valuable to the City Digital Twins project.
The research in itself, on the city problems in Eindhoven is extensive and can be used for future projects that might use a different domain and have different objectives. The same goes for my research on AR.
As for the data aspect, the data I scraped was used by Simona in a research paper2, and my research found inconsistencies in the API from TNO, which is valuable to our expert, TNO and future and past users of the data.
I used my previous knowledge in AI to pick time series models and tuned them until there was a model that worked. This is something that had not yet been done within other projects on fine dust according to Simona.
This all was done within the Fontys Lectorate, where I was almost daily on location, more than was required. Fontys Lectorate focuses on applied research and the sharing of knowledge. Not only did I use applied research for my application, I also shared knowledge at several layers of the project. During the knowledge sharing sessions I shared valuable information, asked insightful questions and provided meaningful feedback to my colleagues. I also shared the project during the XR event, IT Festival and CDT presentation. 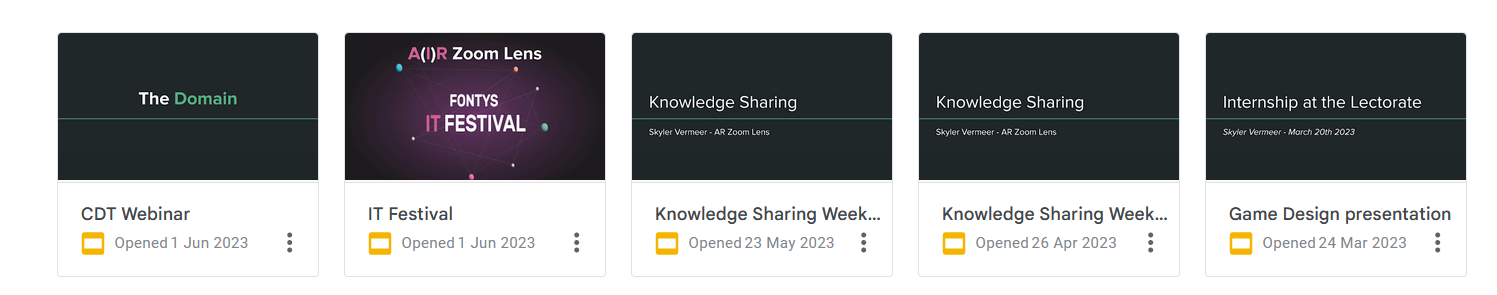
I worked in the environment of the City Digital Twin Projects, and had the company, the expert and the users as stakeholders. Using my portfolio I created a way for the project to be continued and expand the City Digital Twin Projects knowledge.
Future-Oriented Organisation
This project was made for future development and is aimed at improving the awareness around Fine Dust. It touches upon several sustainable development goals, and throughout the decision-making process several aspects were considered. In the sections’ organization, the progress rapports and in the ways that the project is prepared for handover it is clear how I was in control of all aspects of the project and managed them efficiently.
Investigative Problem Solving
During this project I had to shift my focus at several points and had to do my best to not get lost trying to solve a problem and abandoning the goal.
Domain
The first problem I encountered was when choosing the focus of the project. This needed to be researched which I did while making the project plan. To ensure that I didn’t spend too much time on this I decided to spend two weeks on it, with the second week deciding the topic during a meeting with Simona. This allowed me to scope, still spend enough time on it as it was the foundation of the project but make an educated choice within a reasonable timeframe. It also helped that we already had the scope of using the Eindhoven Open Data.
AR
Then we had the aspect of Augmented Reality. Based on my literary research the options were React, Unity integrated into React, and Aframe combined with AR.js. Despite my best efforts I didn’t manage to make any prototypes work except for the Aframe and AR.js combination. I followed tutorials, asked Simona for help and tried out multiple options. Simona suggested I contact Bernd-Jan, who showed me his prototype based on which I could make my own and helped me get an appropriate phone from the ISSD so problems I encountered were most likely related to the software instead of the hardware. So by communicating with my company coach, asking for help and learning when to quit I managed to get a working Augmented Reality component. Arguably, I could have stopped experimenting with the others earlier, however the theoretical research indicated that those were a better fit and Aframe and AR.js were more difficult to work with so I wanted to put a little extra into trying to make the initial best fit work.
Collecting the data
The data was a problem in itself. The gathering of the data took quite long. Just under 50 locations needed to be scraped, the API didn’t like the constant requests and crashed multiple times, and in general I could have made better choices such as only scraping one or a few locations. Alternatively, I could have looked into a desktop computer from school instead of the laptop that I had to travel with. Luckily the holiday covered most of this period, and I managed to do some things while the data was scraping, but this was a time-intensive task that could have started smaller.
Data Analysis
The analysing of the data was also a problem in and of itself. There wasn’t much data aside from the measurements, so not a lot of new information could be gathered from it, aside from means, the data quality and some correlations between the locations. However, seeing as I wasn’t seeing the trends that the expert had confirmed to me there were, I asked for help and Simona also took a look. This lead us towards the 2021 TNO report about the sensors. I started comparing their results with my own, as they should be using the same data. Technically they were, however they took a few additional steps such as only considering data if it was active during 75% of a timeframe (so 9 months out of a year, 75% of quartiles etc). Their visualizations were also grouped by the mean per hour. This still didn’t account for a lot of the differences, so we contacted our expert and later TNO for an appointment. Based on this appointment we clarified some of our own errors or oversights, and we uncovered some errors from TNO that they were unaware of.
Modelling
Meanwhile I was also struggling with modelling. Most of my time series models were drawing straight lines, and even those that came somewhat close, only came close for short-term predictions. Based on the meeting with TNO, and our findings we decided to add weather data. This was only possible within the prophet model. This gave good results, especially when limiting the predictions to only a few hours into the future. This did require us to continuously request the most recent data, but overall it gave an acceptable model.
Deployment
Finally, the deployment. To be able to share it with the outside world, I needed a way to deploy the application. For this, I used docker to host them. However, I soon encountered CORS errors. After a lot of troubleshooting, trial and error and research into CORS, I decided to simply move the requests to the back-end, as CORS wouldn’t allow the requests from the front-end. That is when I decided to set up an API, as I most likely would have had to either way to connect the model to the front-end. After connecting it to my own domain and running it using docker, I was able to use it as a trusted domain. However, the CORS errors only went away on Google Chrome. Firefox was still giving errors. This was because I needed to add HTTPS to the application.
CI/CD
Once I did this, using LetsEncrypt, I started focussing on a CI/CD pipeline as from now on any changes would have to be pushed to the repository to update. For this I needed runners but git.fhict.nl didn’t have any. That is why I also set some up on my own server, where the docker containers were also running. To get this up and running, especially since we were connecting to an external server, took a lot of effort and experimenting, but with determination I was able to set up the runners and the CI/CD pipeline for the front-end and back-end, including code reviews using SonarQube. This allowed me to automatically update my application and thus work more efficiently.
Personal Leadership
Throughout this semester I demonstrated my personal leadership by taking others with my in my own learning. Though I pushed to expand my knowledge in areas such as with Augmented Reality, I also tried asking for help from experts when possible and if that didn’t help enough, scope it down, conclude and use what I learned as advice for future project members that are more experienced in the area.
Just like I mentioned in Situational Orientation I shared knowledge at several layers of the project. During the knowledge sharing sessions I shared valuable information, asked insightful questions and provided meaningful feedback to my colleagues. I also shared the project during the XR event, IT Festival and CDT presentation.
During these moments I also asked for feedback. By taking on multiple opportunities to share knowledge and request feedback from multiple perspectives I have shown that I am actively working on my personal and project development and towards being an IT professional.
Targeted Interaction
Throughout this project I have communicated and collaborated with several partners and stakeholders. First of all there is my company coach, Simona, who is the owner of the City Digital Twin project and the main stakeholder of the project. During this project I had a weekly meeting with Simona, where we discussed my progress, next steps and any troubles I was having. She had access to my repositories, and if I wanted feedback on anything I would send her an email with what I wanted feedback on.
Next there are my colleagues at the lectorate. My fellow interns I mostly had casual conversation with and helped them with their projects. If there was anything I wanted feedback on, I would show it in the knowledge sharing sessions so I would be able to get feedback from both my fellow interns and long-term Fontys employees. With these long-term Fontys employees I also had check-ins once in a while on how my project was progressing. For example Bart helped me when I was struggling with the weight of a fine dust particle and seeing as his project at the Lectorate was also relevant I also shared my portfolio with him every so often so he could read through it.
I also communicated with our expert, Jean-Paul Closé. After getting in contact with him through Simona via email, we set up a lunch meeting where I got to do an interview and we discussed the project and he explained more about Fine dust. Afterwards we had a bit more contact once the data showed irregularities.
TNO was an unexpected partner. After we found some irregularities in the data compared to the report, we contacted them. Through mail contact they already explained a few things, but we did set up a meeting for further discussions. During that meeting they were a bit of a second expert, but we also managed to provide insights for them about the API and how the data could be interpreted.
Through Bart I managed to get in contact with two groups of Semester 6 media students. They were approached by Bart and sent to my testing setup where they could give me feedback on my designs from their expert opinion.
Lastly there were the expo visitors. During this project there were a total of 4 expo’s or variations thereof. There was the poster market, which not a lot of people came to unfortunately. There was the XR Event, where I was able to interact with some people but less than hoped despite the amount of people in attendance. The IT festival was the most successful event, as there was a lot of interaction and feedback from a variety of perspectives. I needed to communicate what I was doing on multiple levels but based on the feedback I managed to make this work. Lastly there was the CDT Webinar. This event there was some interaction, but mostly with people that are working on similar areas. This, of course, is also valuable information.
The way I have had valuable interactions, with multiple people on several levels is good. There were a lot of different types of partners to cooperate with, and I managed to balance them all.
Personal Goals
Incorporate feedback from others
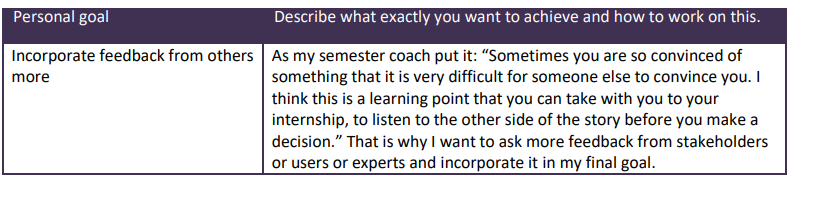 During this semester I tried to take any feedback opportunities that were presented to me. Not all of these succeeded but I did manage to find a balance where I worked with people to incorporate their feedback into my application. I know that there must still have been some rigidness from my part, but whether that was healthy scoping and boundaries or rigidness in allowing other perspectives I cannot determine. Nonetheless I actively worked towards this goal and have improved on this aspect.
Create realistic scopes
 My first scope wasn’t the final scope, but I did work on better adjusting the scopes during the project. Perhaps I could have achieved my original scope if the TNO data didn’t cause such a delay, but this is also part of scoping. I did manage to follow most of my approach and due to my progress reports I also have better indications of how long I spent on something so I could better scope in the future. I did discuss the scope with Simona multiple times. I have sometimes adjusted it based on her feedback, and other times she just agreed with it.
Ask for help on time
 Whether I asked for help on time or could have asked for help sooner is still debatable, but I did ask for help in a timely manner. On several aspects I asked for help, for the domain knowledge I got recommended the expert. On AR I got recommended Bernd-Jan. On AI Simona helped for a bit and we got into contact with TNO. For the people aspect I asked Bart for help and he arranged help from the media students, which in turn is how I got help with the design aspect.
I believe the longest I have waited to ask for help was for the AR aspect, as I wanted to make the theoretical knowledge work, but due to issues with for example versioning this was simply not possible. Still, this was something that I could have improved upon by for example setting a goal beforehand on when I should ask for help.
Reference
-
Goudriaan, R., Zhang, J., Tokaya, J. P., Hensen, A., van Dinter, D., Kaandorp, J. J., Blom, M. J., & Plomp, A. (2022). Regionaal meetnet ILM2 in Zuidoost-Brabant: Jaarrapportage 2021. https://repository.tno.nl/islandora/object/uuid%3A9f6fd889-efce-4e7c-bf4b-56f690e25dac ↩
-
Langhorst, T., Punter, T., Orzan, S., & Witkamp, B.-J. (2023). A mixed data grid approach for systemic city questions. ↩