Process and Results
Structure
To start this project, I set up a structure so I had a clear overview of what needed to be done, a git repository for version control and easy sharing and could also identify areas that I was not sure yet what was expected of me.
For this project, I decided to use Obsidian, which is a markdown editor with a variety of features. The initial features that stood out to me were easy linking between documents, graph view allowing me to see how documents (and research) were connected, the ability to install plugins, the ability to create templates for documents easily and by using markdown the files would be easily viewable in git.
Based on my documentation from previous semesters I created a template for my documentation, used them for each of the planned documents, and adjusted them to match the relevant document better.
I also created a to-do list so I had a better overview of important tasks that needed to be done. Later, I moved this over to Trello, so I could also filter my tasks and make them more visible to myself. I created 3 boards for this: Documentation, Development and Milestones. Documentation was to break down the documentation into bite-sized tasks and make sure I process the information such as expert interviews and feedback. It had the sections ‘To Do’, ‘Doing’ and ‘Waiting on Verification’, and ‘Done’. I also added tags such as ‘waiting on other task’, ‘High Priority’, and ‘Need Help’ to better identify why I hadn’t done a task or which task had priority. 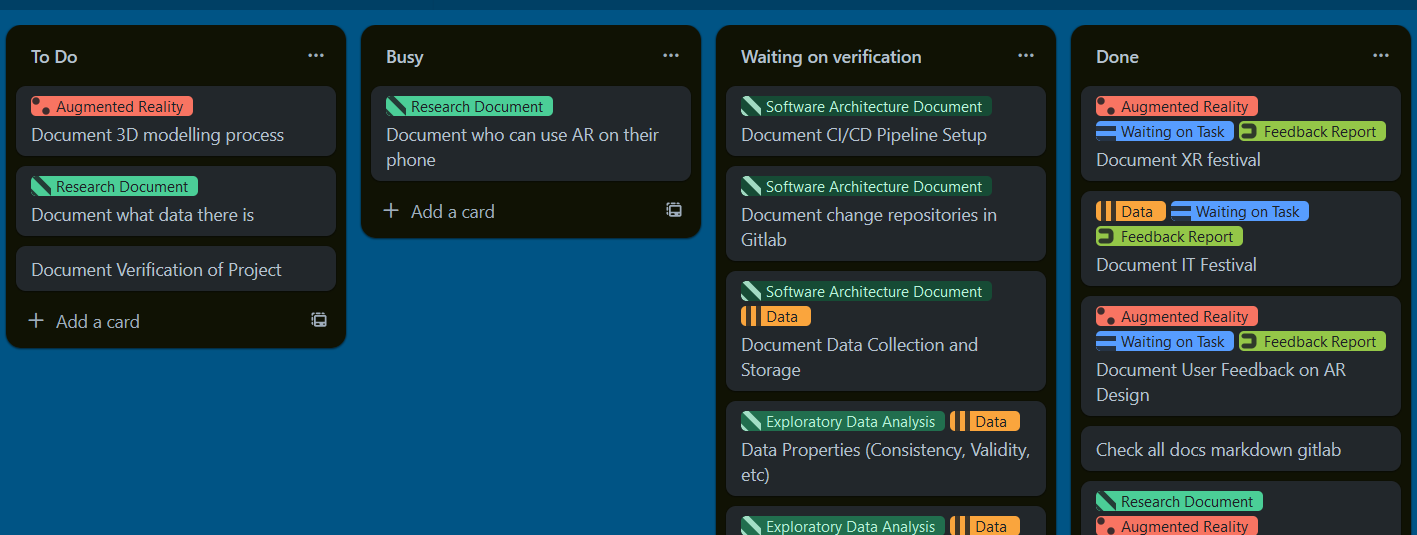 Development had a similar setup but was meant more for concrete tasks such as scraping data, testing, developing a feature, designing etc.
 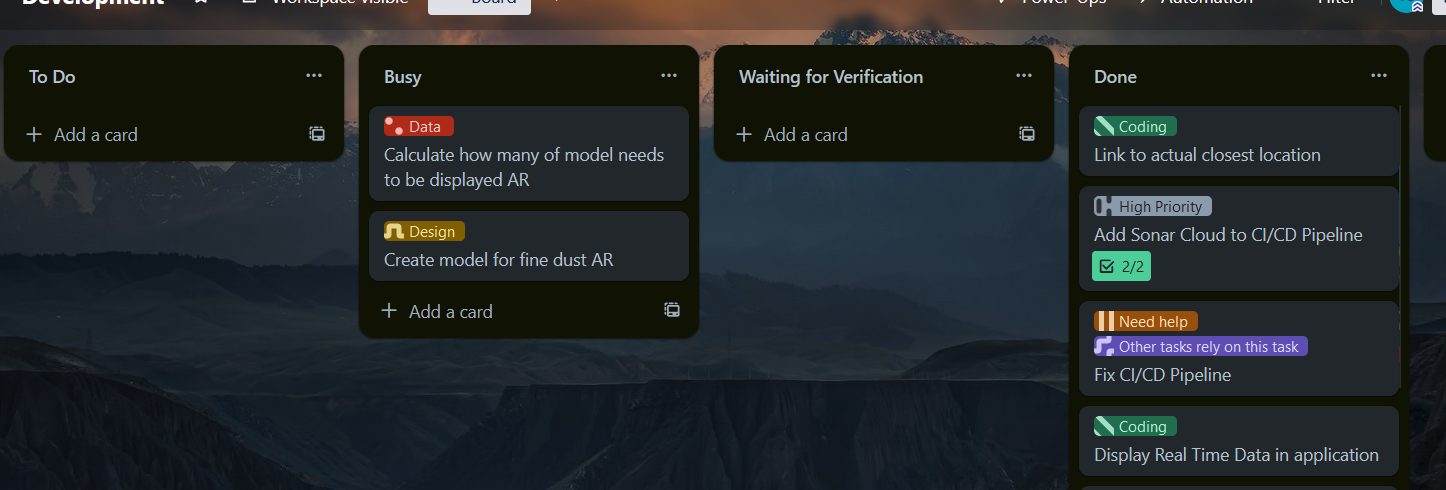 Milestones were meant to keep me on track, make sure I have all the approvals I need, and all the documents I need, and had tasks such as ‘Prediction Chosen’. These tasks are paired with the phases they are associated with, as described in the approach section.
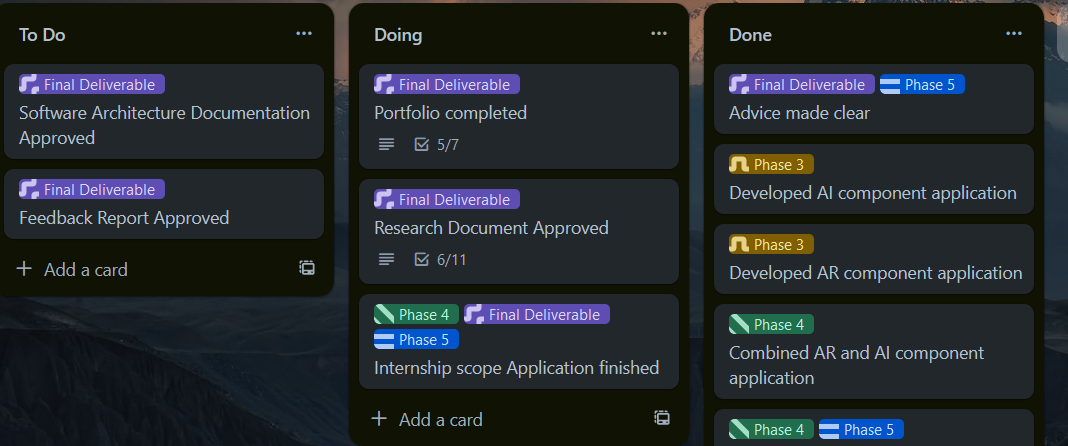
For the Git Repository, I used the FHICT Gitlab, allowing my company coach and assessors easy access, easy display of markdown and easier transferring if the project continued. Initially, I had a single repository, however, I noticed that if I was experimenting and wanted to work in branches, this meant I could not for example do my documentation because the experimentation branch was multiple commits behind the experimentation branch, and if I had something that was running for a while, I couldn’t just switch branches as that would remove the progress. To fix this issue, once the progress allowed for it, I set up 3 repositories: cdt-a-i-r-zoom-lens-documentation , cdt-a-i-r-zoom-lens-front-end and cdt-a-i-r-zoom-lens-back-end. This way I would always have access to my documentation, and my front end, consisting of Augmented Reality and such was separated from my back end, consisting of my data analysis and modelling. These repositories were also shared with my company coach, Simona, so she could see my progress and do her own experimenting when needed.
Problem definition
The next aspect was to define the problem. To start this, I transferred my Project Proposal into my Project Plan. Based on this I knew I needed to scope down my project to a single city problem. That is why I did initial research to answer the questions: “Which city problems are being monitored in Eindhoven?” and “What impact do these city problems make?”. For this, I did literary research which was documented in the Research Document, specifically 1.1 and 1.2. I started the research off by looking at which problems were noted in the Eindhoven Open Data portal, and connecting these to their origins: Population Growth and Urban Growth. Next, I started looking more into the impact of these problems and documenting this. Based on this research, I made a SWOT analysis of the different problems to see which would be the best to scope our project on.
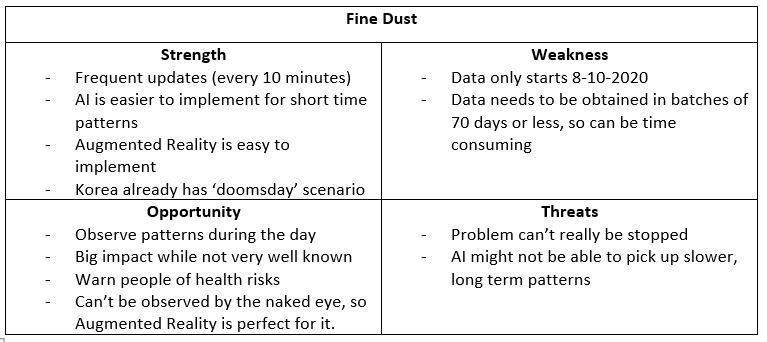
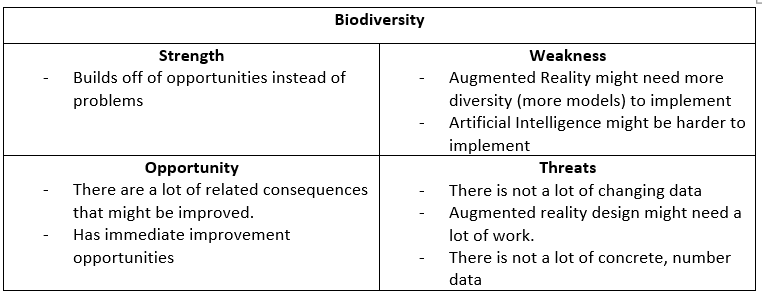
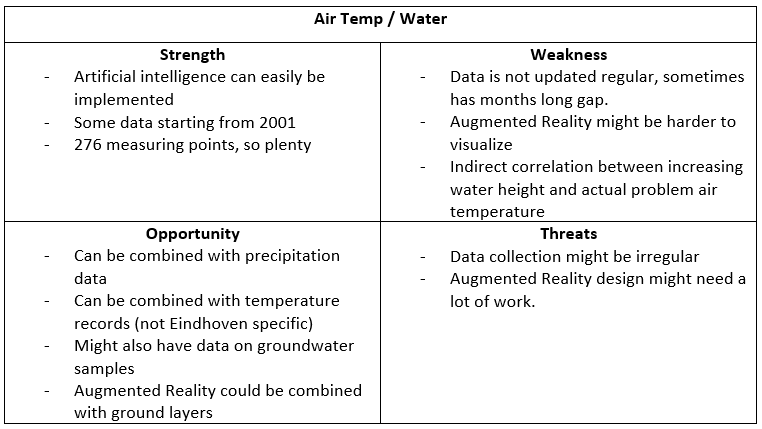
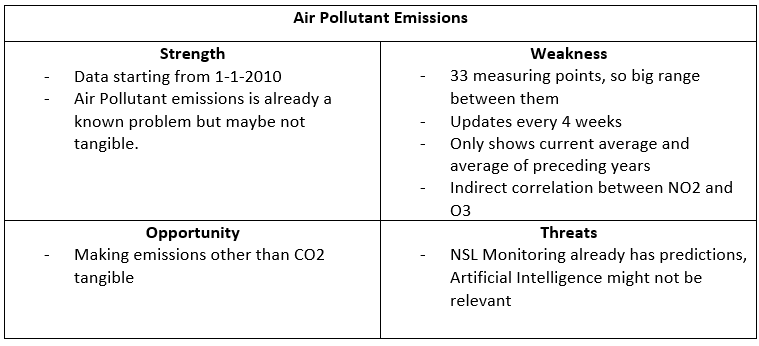
Based on this, together with Simona, I decided that Fine Dust was the best choice to move forward, as this was the one with the most potential for success and would incorporate AR and AI the best. The complete breakdown of this decision-making process can be found in the conclusion of chapter 1 of the Research Document.
I was planning to make a requirement prioritization as indicated in the project plan, but during the research the priorities kept shifting as we discovered more and more things that we needed clarification on so I resorted to just discussing the current priorities with my company coach during our weekly meetings.
Theoretical / Domain Research
Now I knew what problem I was going to be tackling, I was going to need more knowledge on a variety of subjects. Particularly, Augmented Reality and Fine Dust. Though there was enough information to choose Fine Dust as the scope, to be able to make it more tangible more knowledge on the subject was needed. As for Augmented Reality, more knowledge was needed on what it was and what choices needed to be made. That is why Simona invited Jean-Paul Close to join our project as an expert. After talking to him, I documented my findings in the Research Document, under 1.2 What impact do these city problems make?, and noted him as the source.
Based on the recommendation of my first assessor, I contacted Aytaç Sarkmaz for his research on Augmented Reality so I could scope the different types of augmented reality and the different frameworks and platforms. I combined this with more literature research on Augmented Reality in general and on the types where applicable and documented this in the Research Document, under 2.2 What is the best Augmented Reality technique for this application?.
Later on in the project, after the key development decisions were made I also researched what devices the AR application will be available on. It is currently supported on browsers on newer versions of Android but not iOS. All this research can be found at 4.1 What devices will the AR application be available on?
Practical Research
As for the more practical research, I used several methods. I supported the choice of the Augmented Reality technique by using several Proof of Concepts to see which aspects worked and didn’t work. These can be found here: React Application, React Unity Combo, HTML/CSS (multiple)
I also answered research question 2.1 How can this problem be visualized? in the Research Document. For this, I created sketches and discussed them with my stakeholder. After that, I created a clickable wireframe and tested this with Semester 6 Media students. Initially, the goal was to use a survey and test it with the visitors at the poster market, however, the attendance at this event was not as high as expected and thus I had to resort to Media students. Based on their feedback, I updated my designs and then verified them with my company coach and the expert.
Based on these verified designs, I started developing the application using HTML, CSS and Javascript in combination with AR.js and Aframe. I created some custom models, so I could test the application using a custom model instead of the built-in features such as a-plane. I used Blender for this as this is an application I was already somewhat familiar with. 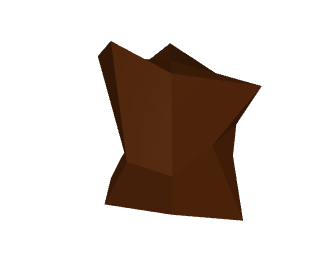 The model was a good recognizable model for the development, but it didn’t look good so when the problem of the weight of Fine Dust came up, I decided together with Simona to go for brightly coloured sphere’s scaled to the particle.
  Around this same time the visual was adjusted to have the sphere’s depicted on a plane instead of flying around, to make it easier to position and see.
Another important aspect of this project was the data that needed to be visualized. Once the decision was made which problem we were going to be researching, I started looking at how I could obtain the data. The download would require a manual download of every location separately, per 70 days. This was not feasible so I started using the API.
I should have scraped a small timeframe or one or two locations, but I decided to create a loop that would scrape all the available locations from their original date to the current date. These requests were per 10 minutes, with longitude, latitude, NO2, PM10, PM2.5, PM1 and UFP separate in batches of 144. This means that approximately 3,5 hours were sent per request. This took a while, as it had to be done per location and the API crashed repeatedly. Luckily I did this over spring break so I wasn’t waiting on the data and I could also work on some of the research in the meantime.
Once the data was in, I could start exploring it. I started with one single location, and started preparing it as I wanted all the measurements grouped per time it was measured. I also checked whether all the units were the same, and checked that the longitude and latitude values were not trustworthy as the most commonly provided location was not the actual location it was placed.
I visualized a single day to see any patterns or outliers. 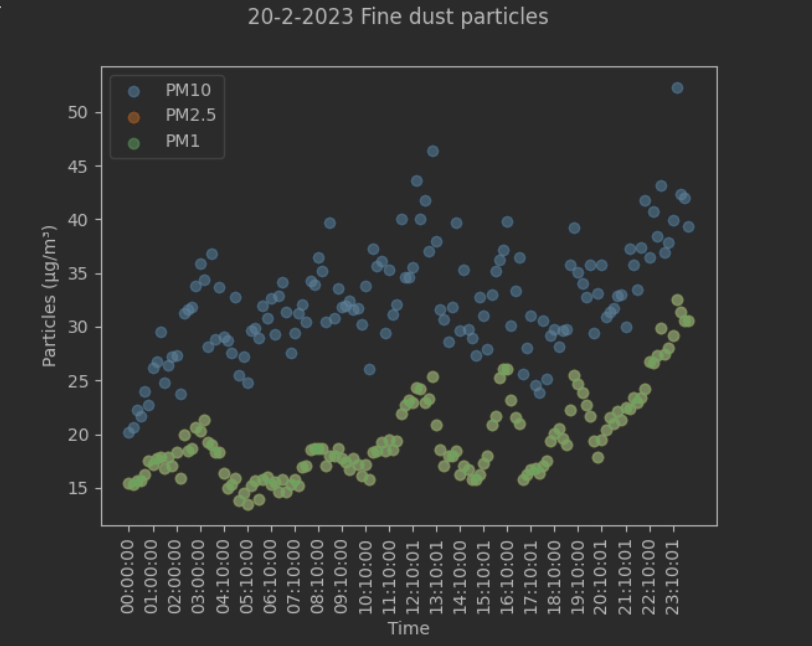 A clear correlation between the PM values is visible, and PM2.5 and PM1 seem exactly the same, but I checked and there is a difference, but on the scale with PM10 it is not very visible. I continued checking from various perspectives, such as decomposing the time series but I didn’t observe a lot of actual trends and seasonality.
Based on this Simona obtained a report1 from TNO about these sensors. I started comparing my data to this report, and started finding inconsistencies that I couldn’t explain. Based on this we contacted TNO and they could explain some inconsistencies due to actions I had not taken such as only using data that had collected data for 75% of the timeframe that was being looked at. Other inconsistencies were not explained by them, so we set up an in person meeting. Based on this meeting there were a few things that TNO was unaware of, and a few advices and feedbacks I had gotten and I continued based on that.
Based on the knowledge acquired through the EDA, the expert and TNO I started modelling using time series and later on also including weather data. Based on this I only found Prophet to be a suitable model as the other ones practically drew straight lines, ignoring the seasonality in the data. Prophet: 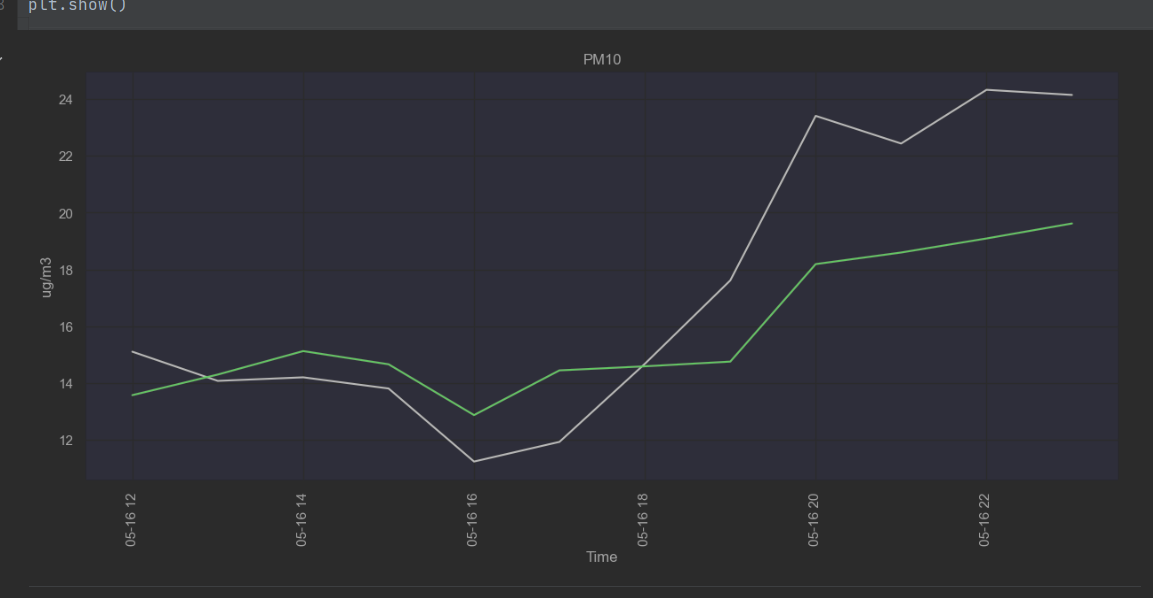 Example of a different model:
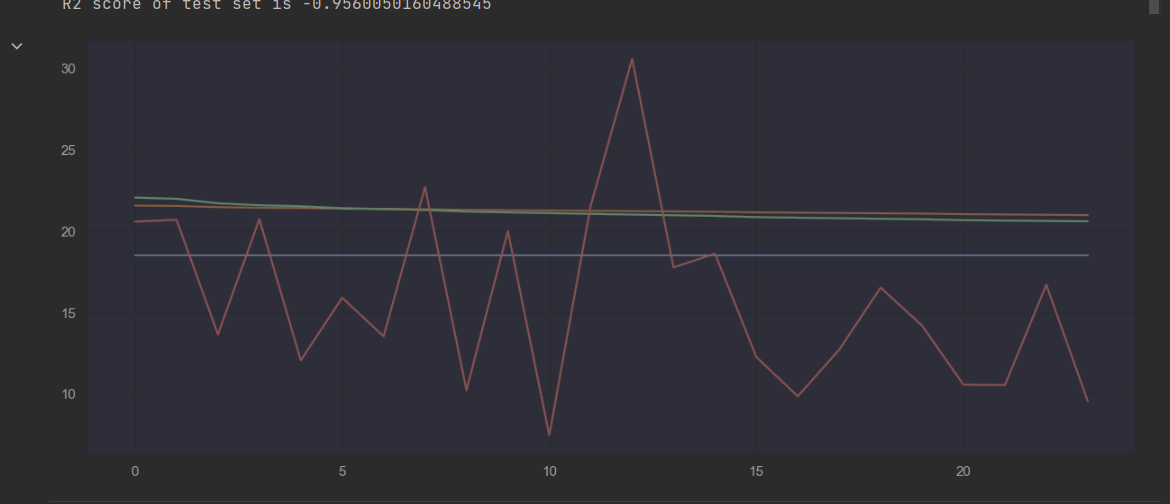
Nearing the end of the project, in May and June, there were several expos that I was invited to share my project at. The XR event, the IT festival and the CDT webinar. As all of these things had a different focus, this became the deadline for the development of each of these focuses. The XR event meant that I needed a functioning AR component, which I succeeded at. The IT festival meant that I needed an implemented AI component, which I also succeeded at and the CDT festival was the combination of the two, however seeing as I had already accomplished that during the IT festival, I focused on a finished advice here.
Based on the feedback I received at these events, and processing it in the Feedback report, I composed an Advice Report that detailed what the feedback revealed which could not be processed during the current project.
Results
The results of my research are visible in the following documents:
- Project Plan
- Exploratory Data Analysis
- Modelling Notebook
- Software Architecture Documentation
- Research Document
- Feedback Report
- Advice Report
All research and code can be found on the documentation git , the front-end git and the back-end git. The deployed version of the application can be found on cdt.skylervermeer.nl.
Conclusions
As detailed in the conclusion of the Research Document, the severity of fine dust in Eindhoven can be visualized using AR in a way that is accessible and understandable to the users using future iterations of the application currently on cdt.skylervermeer.nl. Currently the severity is not properly understandable and not accessible enough. With the processing of the advice report, this application should come close to being an answer to the research question.
Recommendations
For the recommendations, I refer you to the Advice Report.
References
-
Goudriaan, R., Zhang, J., Tokaya, J. P., Hensen, A., van Dinter, D., Kaandorp, J. J., Blom, M. J., & Plomp, A. (2022). Regionaal meetnet ILM2 in Zuidoost-Brabant: Jaarrapportage 2021. https://repository.tno.nl/islandora/object/uuid%3A9f6fd889-efce-4e7c-bf4b-56f690e25dac ↩